
 In an article for the “In Focus” section of Political Insight (September 2014, Volume 5, Issue 2) we looked at the results of this year’s election to the European Parliament.
In May 2014 the citizens of the 28 member states of the European Union (EU) went to the polls to elect the 751 new Members of the European Parliament (MEPs). The distribution of seats in the European Parliament is not directly proportional to each country’s total population. A so-called ‘degressive proportionality’ principle gives small countries a few more seats than what would have been the case if strict proportionality were applied. The voter turnout across the EU was 43%. Belgium and Luxemburg have the highest rate of voter participation (90%). On the other hand, the smallest voter turnout is observed in Slovakia (13%) and the Czech Republic (19.5%), whereas the United Kingdom had the 11th lowest rate in Europe (36%). More than 90% of all elected MEPs belong to one of the seven political groups of the European Parliament. There is a minimum of 25 members needed to form a political group and at least one quarter of all member states must be represented within this group.
The map series in the article presents the geographical distribution of the votes across member states. All countries in these maps are shaded using a rainbow colour scheme, starting with shades of dark red to demarcate the countries with the most recent association with the EU and moving through to a shade of violet for the oldest member states.

The largest political group is the European People’s Party (EEP). There are no MEPs from the UK belonging to EEP. This was the group that the UK Conservative Party used to be part of. The second largest group is the Progressive Alliance of Socialists and Democrats. This is the political group to which the UK Labour Party belongs. The European Conservatives and Reformists is the third largest group and is the current political grouping of the UK Conservative Party. The next largest group is the Alliance of Liberals and Democrats and is where the UK Liberal Democrats party aligns. The fifth largest group is that of the European United Left/Nordic Green Left; its one UK MEP elected in Northern Ireland being from Sinn Fein. The Greens/European Free Alliance is the sixth largest group in the European Parliament. The UK has three MEPs belonging to that group of which three come from the Green Party, two from the Scottish Nationalist Party and one from Plaid Cymru. The smallest group in the European Parliament is the so called “Europe of freedom and direct democracy” with half of its seats won by the UK Independence Party. Finally, the UK has one seat in the category of MEPs that do not belong to any group, the seat held by the Democratic Unionist Party in Northern Ireland.
When the European election results were reported attention naturally focussed on changes since the last election. However, it is also useful to look again at how political parties in Europe have now come to be arranged. Although they are the largest group, the parties belonging to EPP, the group of the right, barely hold more than a quarter of all seats. The socialist parties combined with the Greens are a far larger combination. The Liberals are a very small group in Europe, much smaller than the group of – what in European terms – count of as the extreme parties of the right, including the UK Conservative party and UKIP. Europe both encompasses a wider politics than is seen in any individual country of the Union, and a more complex one.
As not all maps that I created for this analysis were published in the article, here comes a full overview of them, showing each of the individual groups represented in the parliament, as well as the maps of seat distribution and voter turnout across the 28 member states of the European Union in 2014 (groups in the European Parliament are shown in alphabetic order):
Population distribution and voter turnout
(click for larger version)
Seat distribution
(click for larger version)
Group of the Alliance of Liberals and Democrats for Europe
(click for larger version)
European Conservatives and Reformists Group
(click for larger version)
Europe of freedom and direct democracy
(click for larger version)
Group of the European People’s Party (Christian Democrats)
(click for larger version)
Group of the Greens/European Free Alliance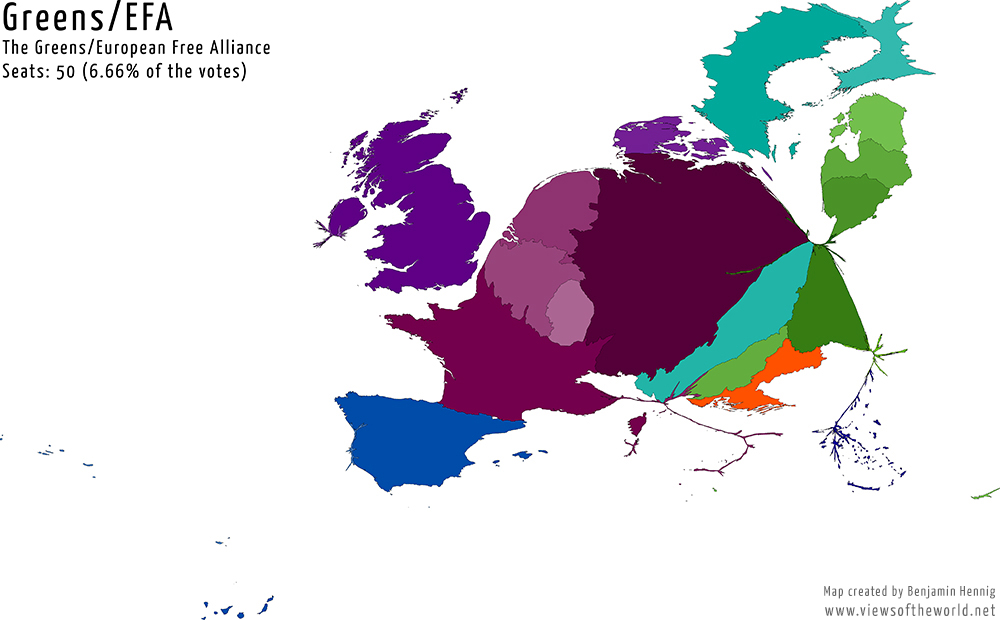
(click for larger version)
Confederal Group of the European United Left – Nordic Green Left
(click for larger version)
Group of the Progressive Alliance of Socialists and Democrats in the European Parliament
(click for larger version)
Non-attached members
(click for larger version)
The bibliographic details of the original paper are:
- Hennig, B. D., Ballas, D. and Dorling, D. (2014). In Focus: European Parliament elections 2014. Political Insight 5 (2): 20-21.
Article online (Wiley)
More maps about Europe can be found at the Europemapper project and the related book which we launched last week at the Royal Geographical Society in London:
The Social Atlas of Europe
by Dimitris Ballas, Danny Dorling, Benjamin HennigPublished by Policy Press
[Oder your copy here]

The content on this page has been created by Benjamin Hennig. Please contact me for further details on the terms of use.
Pingback: Aye & naw: Scotland's referendum mapped - Views of the World