

In a previous post on this website I looked at urban mapping showing population changes in London. This time I dug up a different example for mapping cities from my map archive: The German city of Cologne (Köln) is one of Germany’s largest cities with a total population of approximately 1 million people. It its over 2000 years lasting history, its urban landscape changed considerably, and since the Prussian times in the 19th century fairly good mapping records cover the modern land use change from the pre-industrialised to the post-modern city. In a GIS mapping project some years ago, these changes have been digitized in full detail from some major topographic maps, covering the changes in the urban land use since 1850 (see bottom image of this page for the legend to this animation):

The picture emerging from this map animation is the story that went on in many German (and European) cities during the main phase of industrialisation, here to be seen in the second half of the 19th and the first half of the 20th century where the historic core of the city is increasingly cramped by the growing industrial suburbs that all become part of the administrative urban extent of Cologne (which originally only comprised of the innermost ring prior to the first Prussian urban extensions).
Today’s city structure is a heterogeneous mosaic of the different major phases of urban development, of which each phase left a unique pattern in the urban landscape since the early Romans built their first fortification at the west bank of the Rhine river in the year 50 A.D. just opposite of an Ubi settlement in today’s quarter Deutz.
The diversity of the innermost urban development was also part of a number of excursions that I did a couple of years ago at the Department of Geography of Cologne University, and for which I created a digital documentation of the route and main locations visited during the field trip with the help of the students that took part in the excursion. The website is German language only, and it also contains a number of resources as downloadable material:

If you want to follow the route shown in that digital excursion, there is a good excuse for geographers to do so next year. In 2012 the 32nd International Geographical Congress takes place in the city of Cologne.
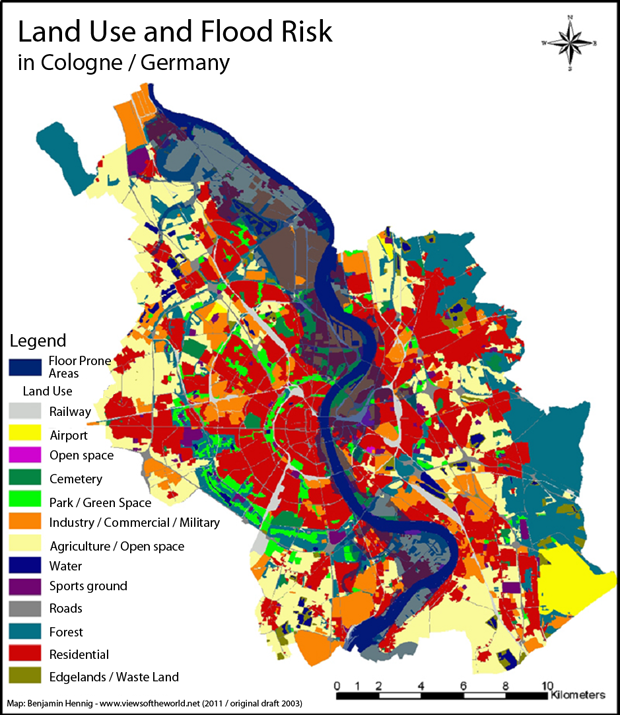
As a city by the river that has been hugely regulated in its upper parts, and human settlement narrowed the natural river bed considerably over the last centuries, so that the flood risk has become a major issue for many cities along the middle and lower Rhine. The low lying historic city core of Cologne and some suburban areas in the South and North are regularly threatened by flood events. A visualisation of these lowest lying areas on the most current land use map shows this problem strikingly in its impact on the residential areas along the river banks. The following map shows the 2000 land use pattern (the legend shown here is the same that applied to the above animation) with the flood prone areas:
Technically seen these maps are based on a quite old-style of map interpretation, that still is necessary when looking at small scale patterns of urban land use. Automated image classification methods have gone a long way, and object oriented analysis approaches have improved significantly in recent years. They are widely used especially in less accessible areas or in regions where a lack of adequate other data is still relevant (such as in slum areas). Nevertheless, this level of detail in the distinction of land use patterns can bot be reached with automated or semi-automated approaches, and the accuracy of these digitised maps depended highly on the manual interpretation by the people analysing the historic maps and the capability to include additional information written down in the maps, whereas computer-assisted analysis of aerial photography can only read and classify the patterns or spectral signatures shown in the image.
With geotechnology entering the public sector, these works have become obsolete in many cities as the administrations start using geographical information systems to keep track of land use and changes in land use, but to get a historic account of them, an old-style approach of a manual map interpretation and some (now a bit easier) work of digitising can still not be completely avoided.
The content on this page has been created by Benjamin Hennig. Please contact me for further details on the terms of use.