
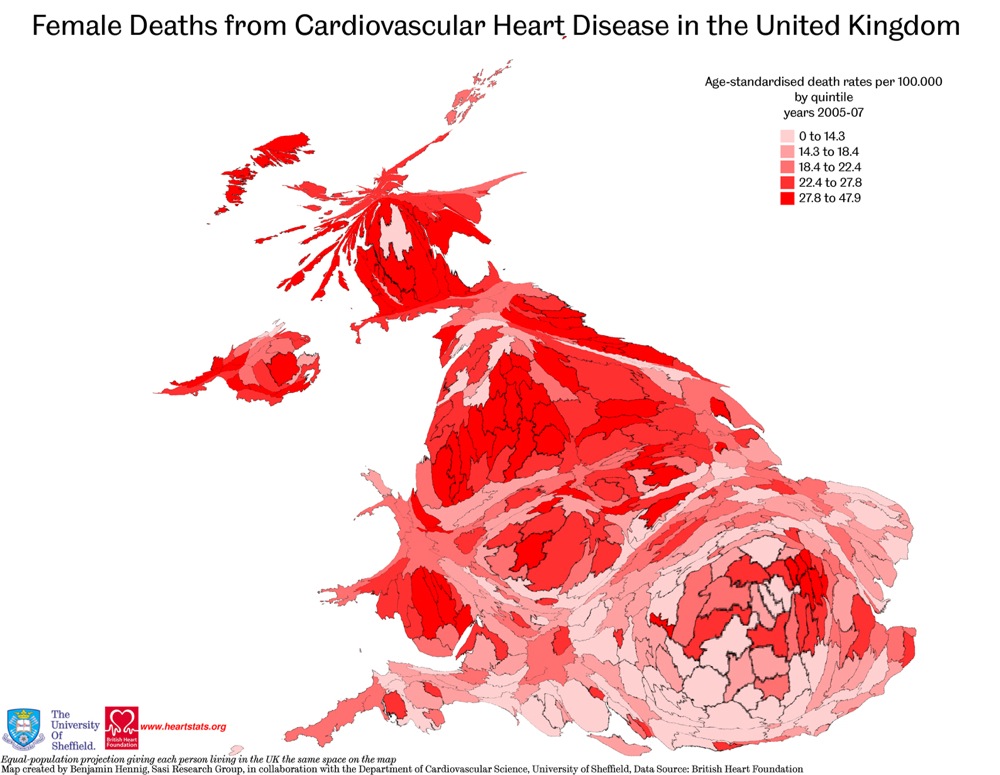
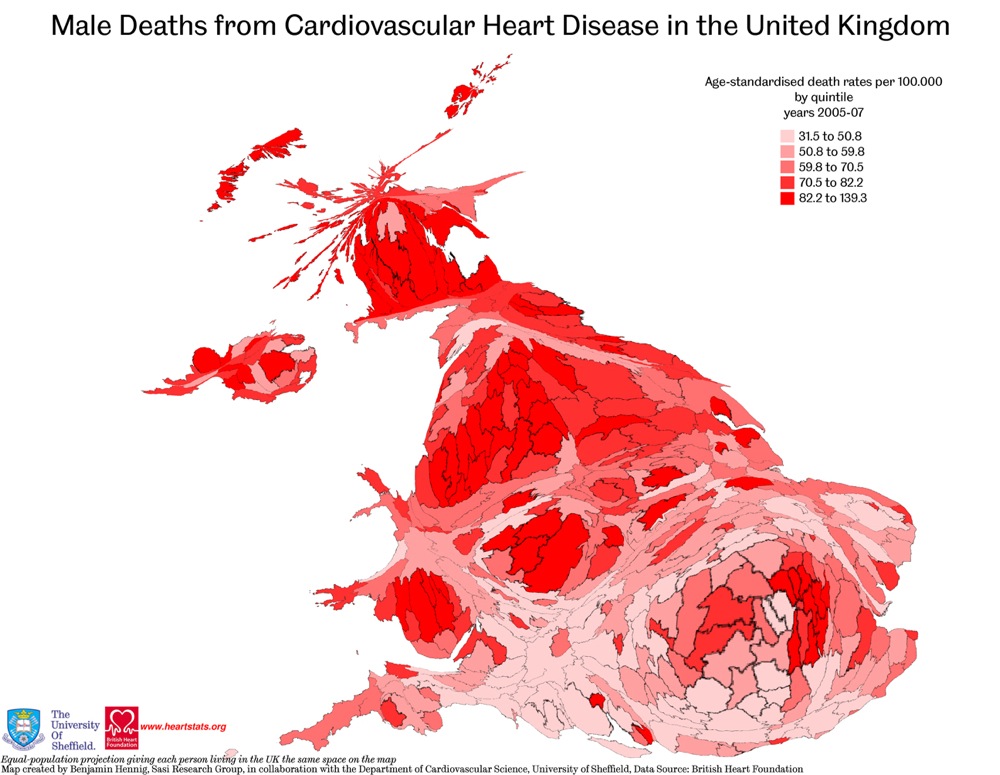
Here are two maps that I created in collaboration with the Department of Cardiovascular Science at the University of Sheffield using data published by the British Heart Foundation (see http://www.heartstats.org/ for more statistics). The maps is coloured by age-standardised cardiovascular heart disease death rates per 100,000 people (split into male and female deaths). Both maps are shaded using the quintiles, thus differ in the absolute rate shown here. This reveals a picture of the prevailing health inequalities in the United Kingdom, with a quite striking North-South divide on the one hand, and an existing division within the Capital as well (East London being most affected in the South East of England). Both maps are drawn on an equal population cartogram giving each person the same amount of space on the map:
 (click for larger map) |
 (click for larger map) |
Heart Disease kills more people in the UK than any other disease. Coronary artery narrowing and blockage is the cause of over 90,000 deaths in the UK (1 in 5 deaths in men and 1 in 6 deaths in women). Death rates from coronary artery disease have fallen since the 70s but are still high and vary according to region. They are highest in Scotland and the North of England (including Yorkshire), intermediate in Wales and Northern Ireland and lowest in the South of England. Drawing out the deaths by local authority in map form, the North-South divide and the concentration of deaths in urban areas can be clearly seen.
How the United Kingdom compares to the rest of the world in terms of heart-related deaths has been shown on the worldmapper website. There we published the following map showing all deaths from diseases of the heart and blood vessels (see the worldmapper website for more details):

(click for the original map on the worldmapper website)
The maps do not only reveal a degree of health-inequalities that do apply to many other health-related issues. The pattern that becomes apparent in the maps for the United Kingdom can be observed in similar ways to many other inequalities in health. On a global scale, we can observe various patterns, as shown in this talk by Danny Dorling about mapping the causes of 57 million deaths: See Lecture (Flash Player required)
For the broken hearts that are still alive, there may be some hope lying in the Zebrafish, who is capable of mending its own heart, as BSH-sponsored research shows:
Reducing inequalities in health will need different solutions though. It starts with an understanding of the patterns that do exist, and the reason why they are like this. Many people from poorer backgrounds will find it hard to benefit from cutting-edge research, as access to health services proves to be one of the underlying problems, and so are – imposed or self-inflicted – different lifestyles. These causes are not only a problem in the poorer countries, and tackling these disparities is as much a global issue, as it is a national one in many countries.
The content on this page has been created by Benjamin Hennig. Please contact me for further details on the terms of use.