

The following map series is a comprehensive overview of the individual second vote shares of each of the parties represented in the new parliament after the 2013 general election (in order of their absolute vote share) and a look at the change in votes compared to the Bundestagswahl 2009 for the party who were in parliament during the last term. I also mapped a few of the smaller parties that are most relevant in the public debate. Please note that the following page may take a while loading due to the large number of maps and their respective filesize.
According to the preliminary result of the elections to the 18th German Bundestag as released by the Federal Returning Officer (on which all maps on this website are based upon), the following second vote shares were achieved by the parties represented in the new parliament (a party needs at least 5% of the second vote share to get into parliament, in addition candidates can be directly elected into parliament over the first vote):
CDU: 34.1%; SPD: 25.7%; DIE LINKE: 8.6%; GRÜNE: 8.4%; CSU: 7.4%
CSU only stands in the Federal state of Bavaria where CDU does not contest any constituencies. CDU/CSU are often referred to as the Union parties and generally cooperate (though not always agree) on main political issues. In the following maps they are shown in one map with their overall result.
Of the smaller parties that did not make it over 5%, FDP is the most prominent one as they are not represented in the Bundestag for the first time since it was formed. The Pirate Party (PIRATEN) did not make it into parliament either scoring only 2.2% of the vote after a number of successful regional elections in the run-up to this year’s general election. The right wing Anti-Euro Party AfD (Alternative für Deutschland / Alternative for Germany) made a remarkable first ever result to a general election with 4.7% of the second votes. The ‘traditional’ right wing NPD in comparison votes 0.2% less successful that in 2009, getting 1.3% of the overall vote.
These are the perhaps most relevant parties whose results made it to the main headlines and found their way into the broader political debate. The following series of maps shows the vote shares for each of the above parties shown on an equal population so that the representation gives the better picture of where how many people votes for a party. To highlight each party’s variation, the colour scale is adjusted for each individual map (divided into 10 equal classes), allowing the patterns to become better visible also for the smaller parties and the geographical patterns of each political shade to emerge in the maps. For the parties represented in the previous parliament, the change map (with one consistent scale) shows the vote share difference in 2013 compared to the 2009 election result.
CDU/CSU

(click for larger version)
SPD

(click for larger version)
DIE LINKE

(click for larger version)
DIE GRÜNEN

(click for larger version)
FDP
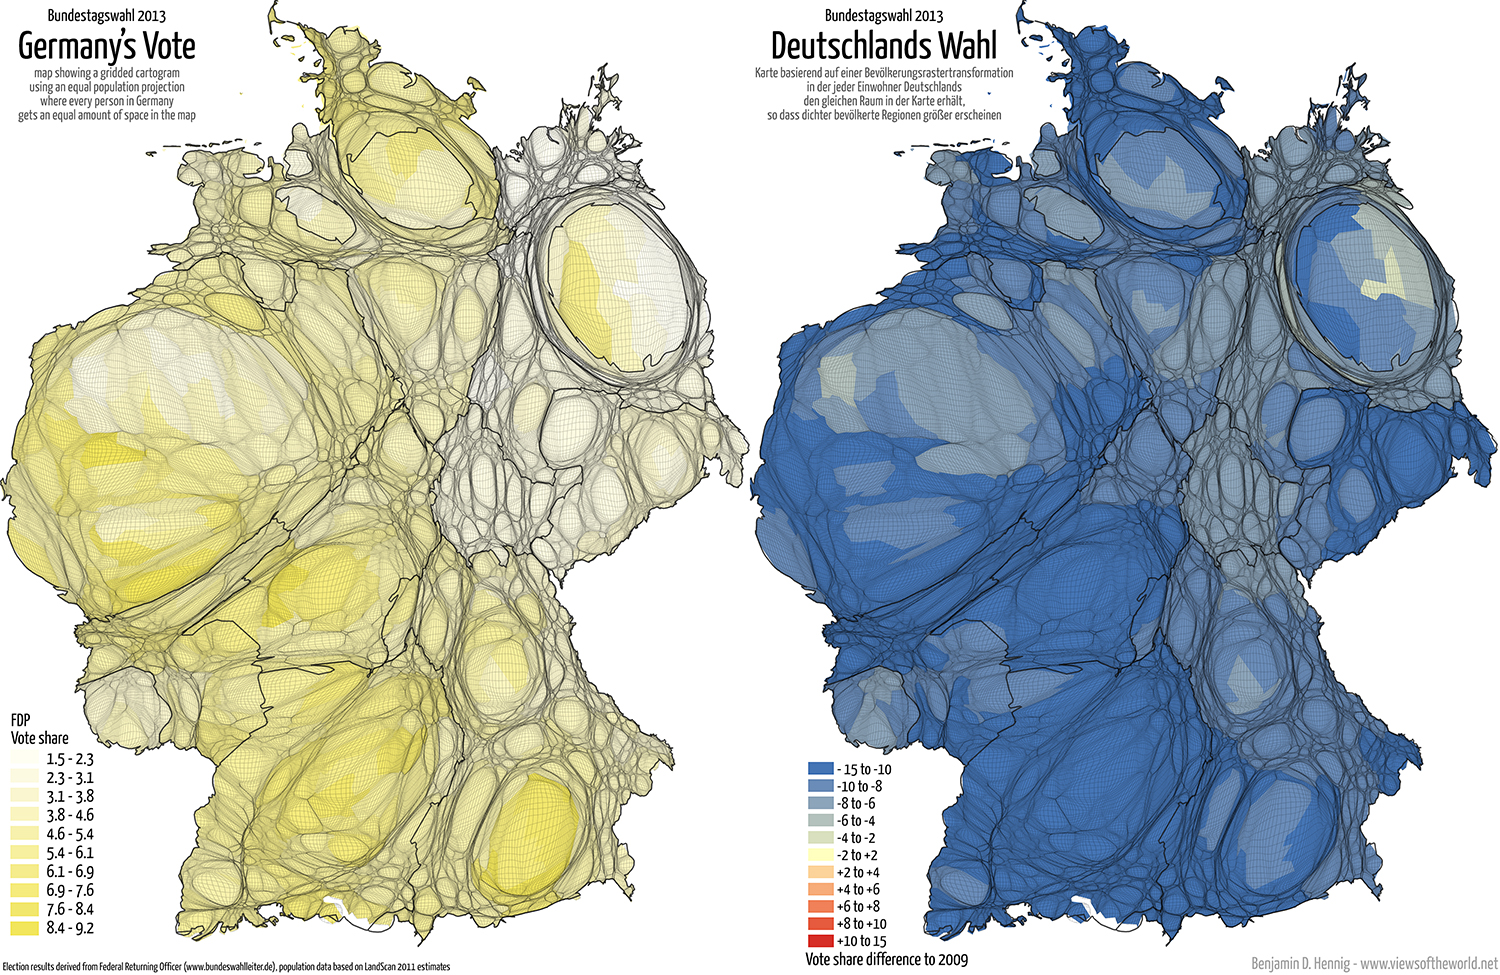
(click for larger version)
PIRATEN – AfD – NPD

(click for larger version)
Here is a full list of all blog posts on Views of the World related to the 2013 general election in Germany with many more maps, and also some entries from the archive of the 2009 election:
- Bundestagswahl 2013: Electoral maps of Germany
- Bundestagswahl 2013: Party time (and hangover)
- Bundestagswahl 2013: To vote or not to vote…
- Bundestagswahl 2009: The winners
- Bundestagswahl 2009: Direct candidates
- Bundestagswahl 2009: Into detail
The content on this page has been created by Benjamin Hennig. Please contact me for further details on the terms of use.