This week I joined the Department of Asian Studies at Palacký University Olomouc (Czech Republic) as a visiting lecturer by invitation of the CHINET project. In my lecture about New Geographies of China I built on the work I have presented earlier this year at the Conference on the Socio-Economic Transition of China at the same place, teaching the students not only how China’s position is in the global context of demographic, social and economic change, but also how we can visualise this in novel ways. The following three maps are an extract from my presentation that gave an overview of this lecture.
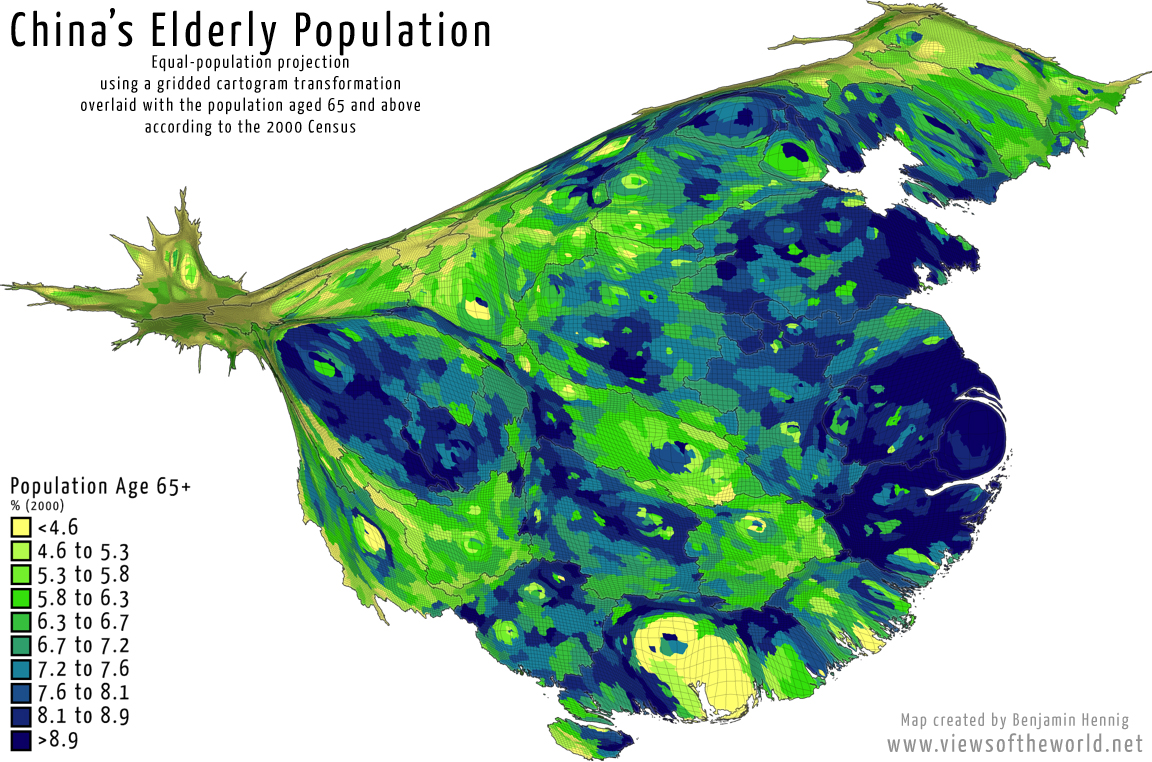
The maps show the distribution of the different age groups in the country divided into children (age 0 to 14), working age (age 15 to 64) and elderly (above age 64) as they are counted in the official Chinese Census released by the National Bureau of Statistics. As the most recent Census figures have not been released at the same level of detail, the following three maps show the state of 2000. Here is an animated version of the three maps showing all three groups one after another (the individual maps are displayed below):
The maps shown here are reprojected on a gridded population cartogram where each grid cell is resized according to the total number of people living there (which I interpolated from the 2000 Census counts). It therefore allows to read the data from a perspective of people, as this equal-population projection highlights those areas where demographics really matter (rather than overestimating the less densely populated regions in the west of China.
Demographic change is an important issue in the future development of the Chinese society. Viewed from a global perspective, the processes of growth and decline in China are unique in its scale and dimension (due to its large population size of now almost 1.4 billion people), and population changes are highly dynamic in the densely populated eastern provinces. Not only do people migrate in large numbers (leading to population decline in some areas of China being almost as large as population decline in the whole of central and eastern Europe), but also do the dynamics of birth rates (population growth now lies at only 0.47%) and ageing influence the demographic spatial structures considerably. Demographic structures are “identified by a large population with a relatively small youth division, which is partially a result of China’s one-child policy”. Gender disparity (as shown here) therefore is only one concern of the complex demographic challenges and the issue of social cohesion, while the distribution of the different age groups feeds into the highly dynamic patterns of population growth and decline across the regions (and the resulting issues of educating the young, providing work for the adults and caring for the older populations).
Amongst the challenges linked to that is the start of the already-beginning decline of the working age population. Peng (2011) summarized the recent Census figures in a Science paper: “The share of the total population aged 0 to 14 declined from 22.9% in 2000 to 16.6% in 2010, whereas the proportion aged 65 and above grew from 7.0% to 8.9% during the same period. This indicates that China’s population is aging rapidly.”
And related to the demographic changes, he concludes that “China is at a demographic turning point: It is changing from an agricultural society into an urban one, from a young society to an old one, and from a society attached to the land to one that is very much on the move.”
That this transition also has some very spatial implications is shown in the map series that I created from the 2000 Census data which – not in the same numbers, but still in the distribution of the age groups – reflects today’s situation to a high degree and highlights, where the discrepancies between (declining) younger and (growing) older populations lie in their regional distribution and how they compare to the overall population distribution. Here are the individual maps from the map animation above:
Children

(click for larger version)
Working Age

(click for larger version)
Elderly

(click for larger version)
The full set of slides from the lecture providing more context about how the maps work and how China fits in with the global geography as well as how it is shaped in its own regional spatial realities and its demographic structures:
The content on this page has been created by Benjamin Hennig. Please contact me for further details on the terms of use.

