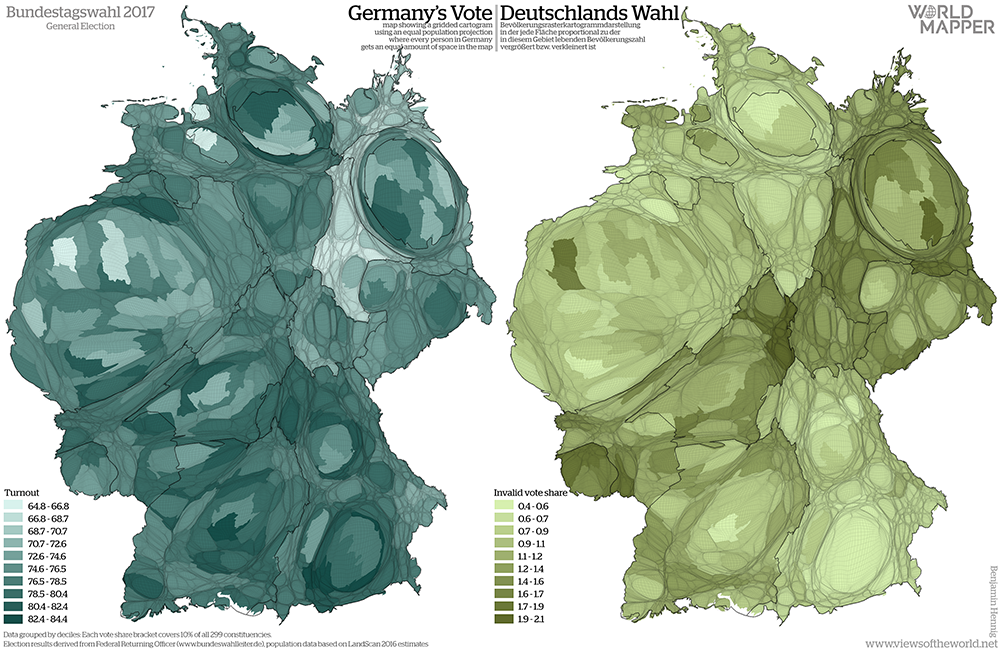
The following cartogram series provides a detailed look into the changed political landscapes in Germany following this year’s general election. While the previous maps gave an insight into the strongest party in each constituency, these maps give a clearer picture of the vote share distribution that also determines the constitution of parliament which follows a system of proportional representation.
Despite an increased turnout which went up to 76.2 percent (from 71.5 percent in 2013), non-voters (23.8 percent) are still the second largest group in German politics. With 14.7 million eligible voters who decided not to vote this group is even larger than the total number of votes of the largest party (CDU), which received 12.4 million total votes in the list vote (Zweitstimme). The following two maps show the distribution of turnout and also the distribution of the 466,942 spoiled votes on an equal-population projection:
Turnout and Invalid Votes

(click for larger version)
The above maps as well as the vote share in the following maps shows the underlying data divided into decile groups based on the country’s 299 constituencies. This means that 10 percent of the constituencies fall into each of the 10 classes depicted in the maps. This allows for a better understanding of each party’s strongholds across the country and therefore gives a picture of the new political landscapes that are going to shape German politics in the forthcoming years.
The following maps visualise the vote share of all parties that are represented in the new parliament (a party needs to reach 5 percent of the vote share to enter parliament) using the above described approach. In order to also understand how these political landscapes have shifted and changed since the last election, the map on the right shows, how each party’s vote share has changed in percent point compared to the 2013 general election. The classes in the change maps remain constant in all maps which allows these changes to be seen in comparison across all parties. The maps below are ordered in decreasing order of each party’s vote share at the 2017 election:
CDU/CSU (26.8/6.2%, 200/46 seats)
Shown in a combined map since the two sister parties do not compete:
CSU stands for election in Bavaria only, where CDU does not operate

(click for larger version)
SPD (20.5% / 153 seats)

(click for larger version)
AfD (12.6% / 94 seats)

(click for larger version)
FDP (10.7% / 80 seats)

(click for larger version)
Die Linke (9.2% / 69 seats)

(click for larger version)
Die Grünen (8.9% / 67 seats)

(click for larger version)
The content on this page has been created by Benjamin Hennig using preliminary results of the 2017 election published by Bundeswahlleiter. Please contact me for further details on the terms of use.

Pingback: Bundestagswahl 2017: Electoral cartograms of Germany - Views of the World