
The 2018 FIFA World Cup in Russia has not been without controversy from the very beginning, starting with corruption allegations during the selection procedure to the most recent political incidents. And yet, the ball is rolling and the sporty side of the event is now getting more attention. From a data perspective, football world cups have become a gold mine that also helps to put a spotlight on the geographical landscapes of one of the most popular sports around the world. The world cup has become a game of dominance of European and South American dominance, while part of the appeal of the game is the unexpected success of ‘underdogs’ that beat the big players. The following maps are taken from a new series of football cartograms made for the Worldmapper website that visualises over eight decades of the event’s history. This is the shape of the football world:

World Cup Participations 1930 to 2018
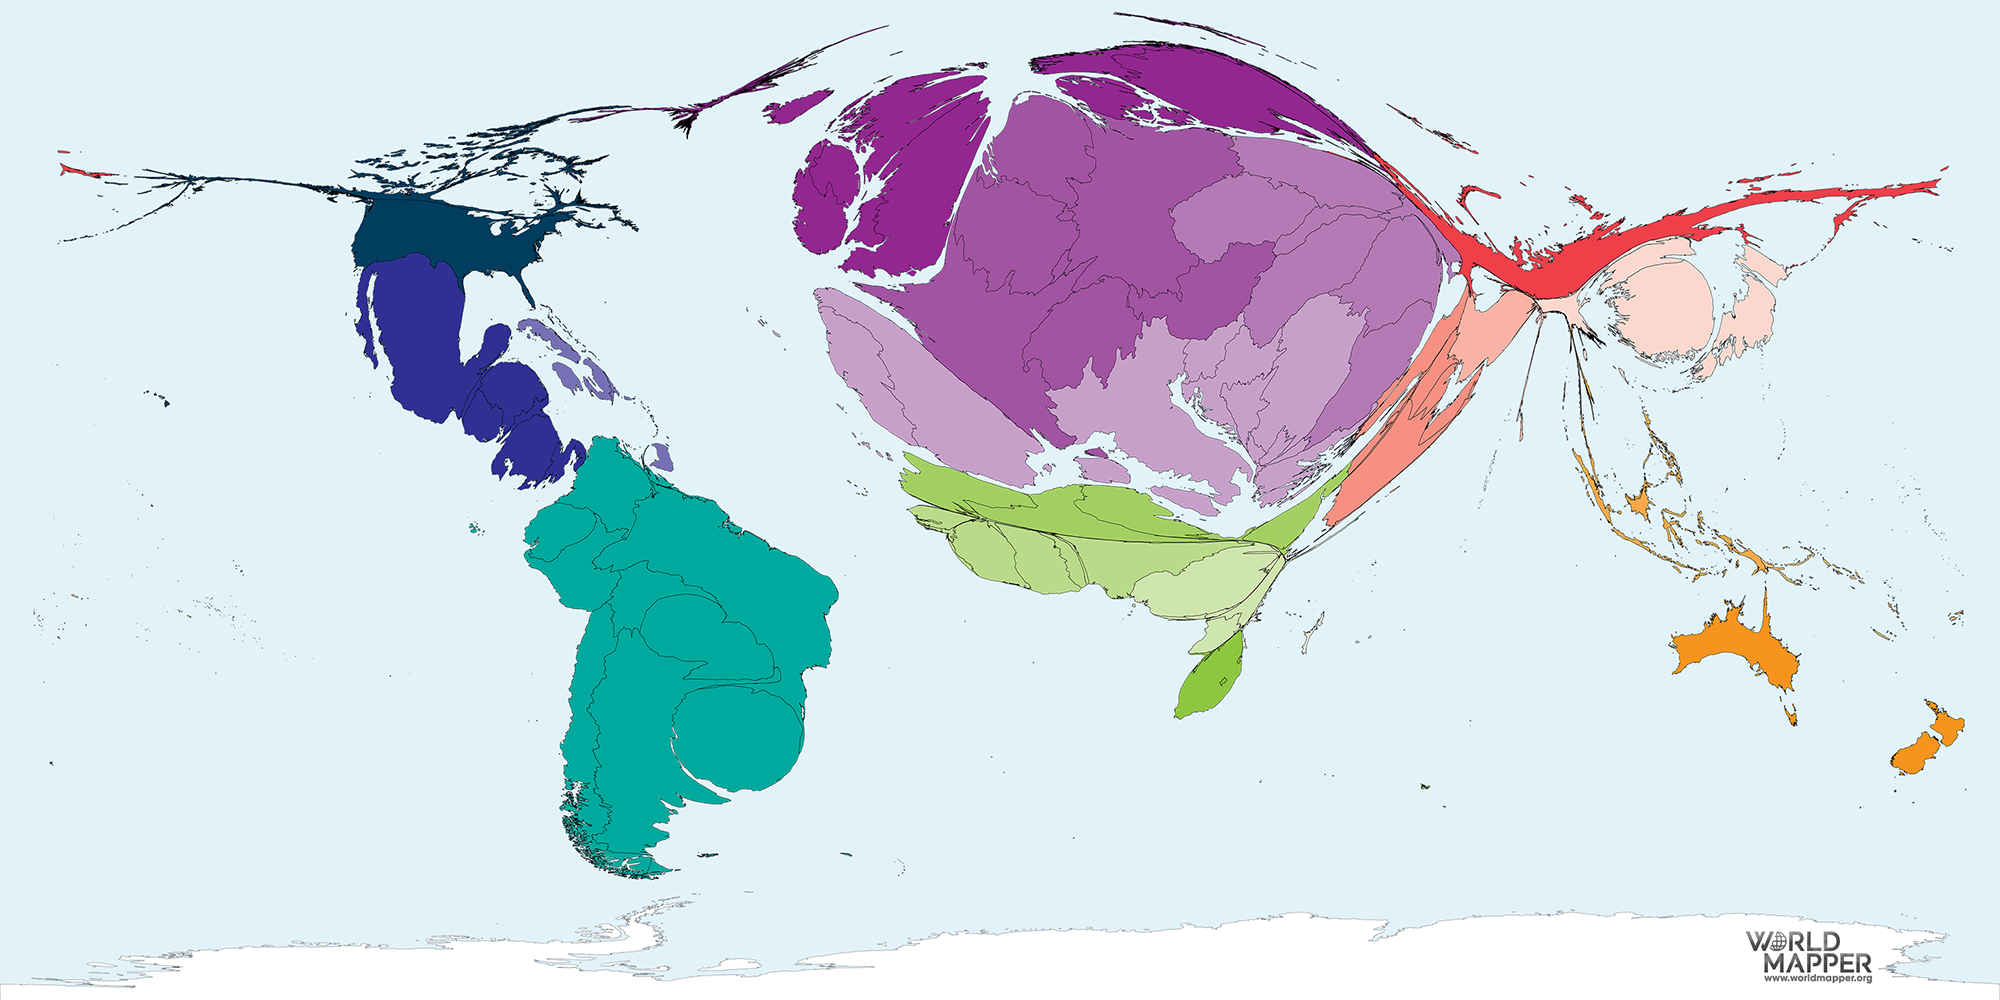
Want more of this? See the full football world cup map series on Worldmapper.
The new Worldmapper website has been realised by Tina Gotthardt and Benjamin Hennig. All content is the property of Worldmapper and published under CC BY-NC-SA 4.0 conditions. Please contact us for more information on the terms of use or if you have any other questions about Worldmapper.
Oh, and while you are here: we still need your help! We had to move Worldmapper to an upgraded webserver to keep the site stable. Since this is all financed from our personal pockets, we kindly ask for a small donation that will help us to keep the new webserver up and running. Please support us: