
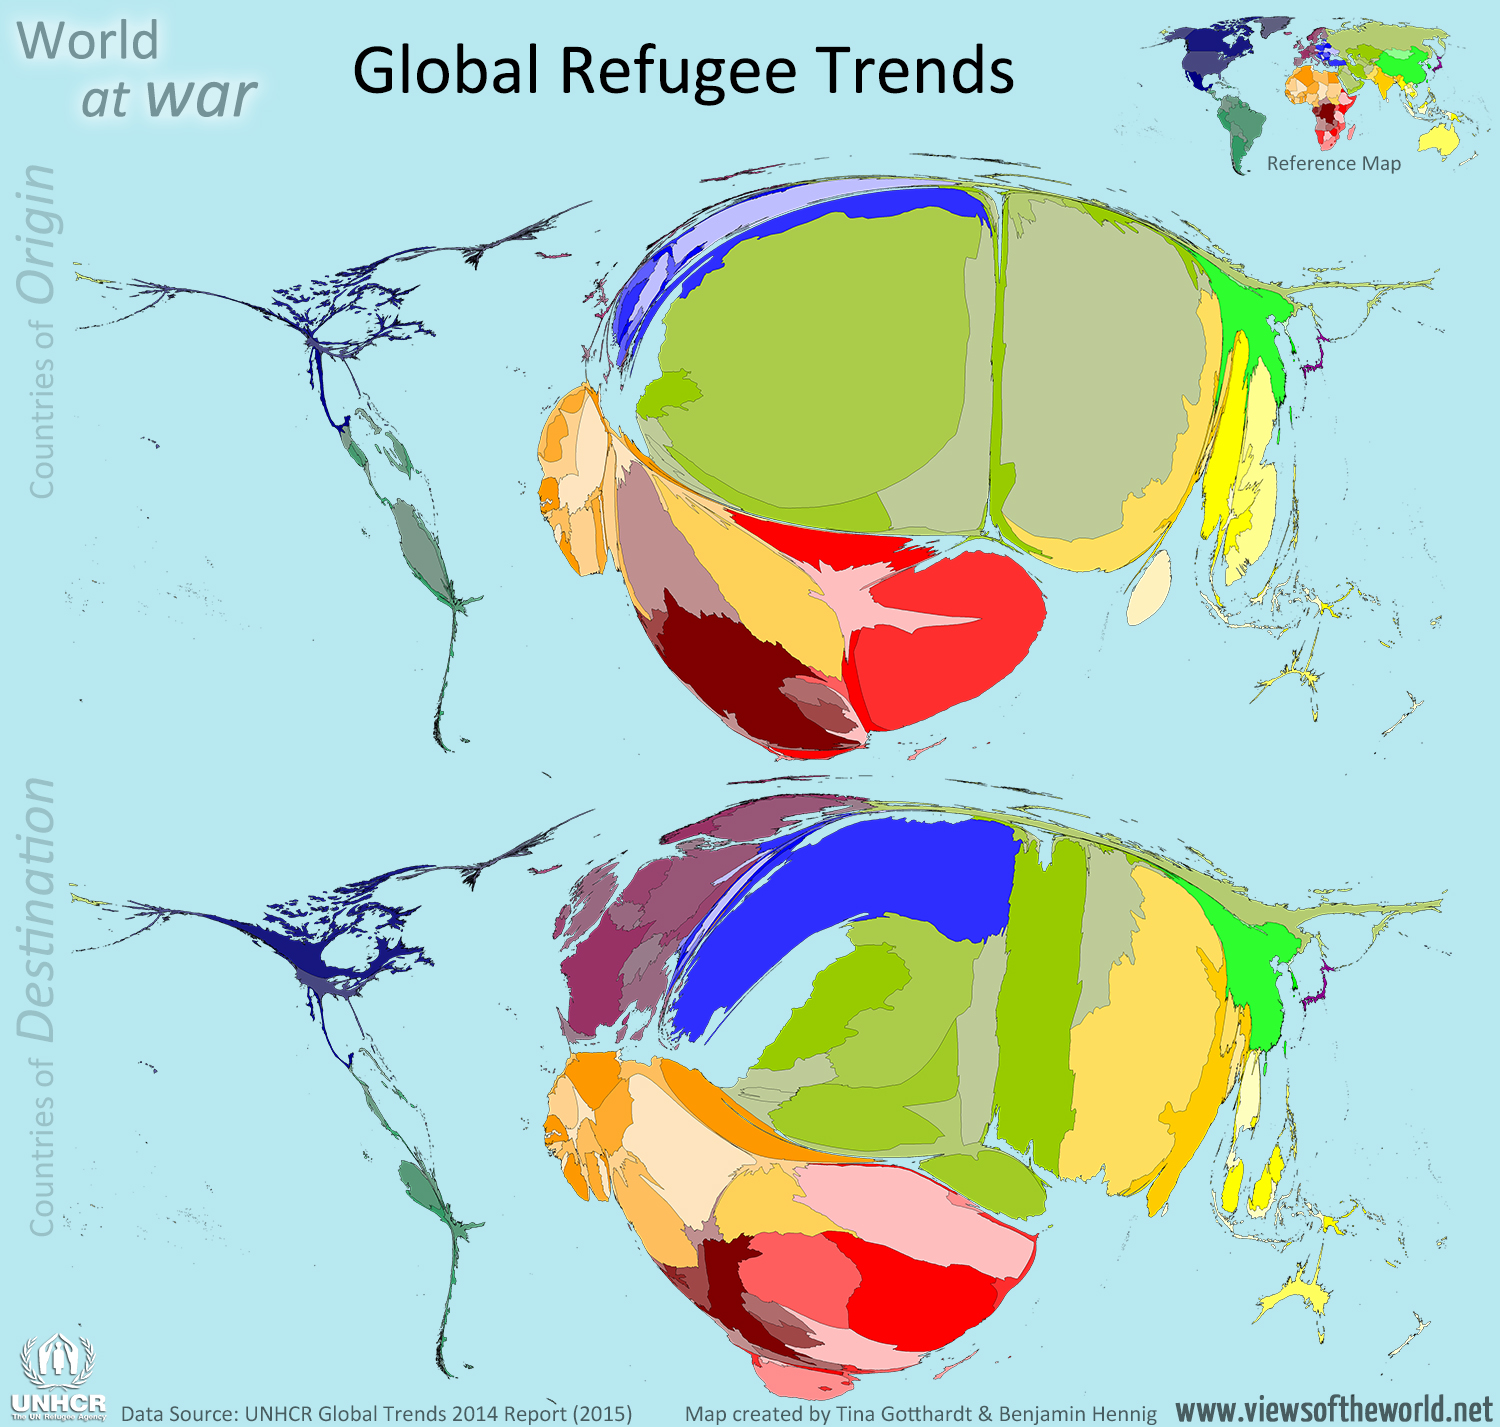
 The UNHCR Global Trends 2014 Report released earlier this week by the UN High Commissioner for Refugees finds that “wars, conflict and persecution have forced more people than at any other time since records began to flee their homes and seek refuge and safety elsewhere“.
Commemorating World Refugee Day, UN High Commissioner for Refugees António Guterres declared in a statement that “around the world, almost 60 million have been displaced by conflict and persecution. Nearly 20 million of them are refugees, and more than half are children. Their numbers are growing and accelerating, every single day, on every continent.” But while the ‘western’ media takes an often embarrassingly western-centric view, and European politicians struggling to find solutions to this global crisis, the report also shows how big this human crisis really has become.
The following two cartograms show the most recent picture of global refugee trends in 2014 as published in the 2015 UNHCR report. The two maps use the total numbers for ‘refugees and people in refugee-like situations’ according to their country of origin and destination and resizes each country according to its absolute number of refugees. Excluded in these maps are those refugees whose origin is unknown or who are stateless or cannot be assigned to a specific country:
Tag Archives: war
British War Deaths
2014 marks 100 years since the start of the First World War. As all around Europe, the British government made extensive plans to commemorate this accordingly (Prime Minister David Cameron’s words of the commemoration saying something about the British people like the Diamond Jubilee celebration were commented critically, while meanwhile commercial advertisers have discovered the emotional power of World War I). So-called Remembrance Day in November saw the display of a poppy field at the Tower of London as a commemoration of soldiers who died in war, a symbol which was introduced following the aftermath of World War I in 1921. But while today’s times are often referred to as the post-war era since the end of World War II, wars keep being fought, and soldiers from countries such as the United Kingdom keep dying in conflicts around the world. Last months the Independent Newspaper published figures from the UK Ministry of Defence (which I spotted on one of Alan Parkinson’s blogs) listing all 7,145 British military deaths since World War Two (including a count of deaths in Northern Ireland). I used that data and edited it according to today’s geography (such as splitting the number of British casualties during the 1950-1954 UN intervention in Korea equally between South and North Korea or assigning the deaths in the former British colonies to today’s independent countries) to draw the following Worldmapper-style cartogram that shows how far we are from living in a post-war era:

A Military World
World military spending for 2011 is estimated to be over $1.7 trillion at current prices, and has come to a relative stagnation after it has been steadily rising in recent years. As summarised on the Global Issues website, “the 15 countries with the highest spending account for over 81% of the total; The USA is responsible for 41 per cent of the world total, distantly followed by the China (8.2% of world share), Russia (4.1%), UK and France (both 3.6%).” The data cited here comes from the SIPRI Military Expenditure Database compiled by the Stockholm International Peace Research Institute who use publicly available data sources for its reports. Military expenditure is defined as “all current and capital expenditure on: (a) the armed forces, including peacekeeping forces; (b) defence ministries and other government agencies engaged in defence projects; (c) paramilitary forces, when judged to be trained and equipped for military operations; and (d) military space activities. Such expenditures should include: (a) military and civil personnel, including retirement pensions of military personnel and social services for personnel; (b) operations and maintenance; (c) procurement; (d) military research and development; and (e) military aid (in the military expenditure of the donor country). Civil defence and current expenditures on previous military activities, such as veterans’ benefits, demobilization, conversion and weapon destruction are excluded.”
SIPRI’s long term observations show how the decrease in military spending following the end of the cold war in the 1990s slowed down at the turn of the century, and has significantly been rising again over the last 10 years – now exceeding the levels of the 1980. A major impact on these figures has the revival of military spending in North America, as the regional breakdown of the data shows. Compared to that, the rise of Asia appears much less significant than one would expect, although the region is clearly gaining importance (see an interactive graphic of the data on the Guardian datablog).
The following cartogram uses the latest available figures of military expenditure from the 2012 update of the database, completed by own estimates for the missing countries. It shows the estimate absolute expenditure in current (2011) US$ for the year 2011:

A year of crises: Global refugee trends
 “A report released by the UN High Commissioner for Refugees shows 2011 to have been a record year for forced displacement across borders, with more people becoming refugees than at any time since 2000. UNHCR’s ‘Global Trends 2011’ report details for the first time the extent of forced displacement from a string of major humanitarian crises that began in late 2010 in Côte d’Ivoire, and was quickly followed by others in Libya, Somalia, Sudan and elsewhere. In all, 4.3 million people were newly displaced, with a full 800,000 of these fleeing their countries and becoming refugees.” (Quoted from the UNHCR Press Release)
In the Worldmapper project we have mapped refugees before (see the maps of refugee origins and destinations) but these maps are far more outdated than most material that we have on Worldmapper. Not only provides the new report a comprehensive updated series of data, but also are refugee numbers of an extremely changing nature as they do not follow general mid- or long-term trends (such as changes in population or carbon emissions). As the introductory statement indicates, humanitarian crises and other hardly predictable events can result in changing refugee patterns.
The following two maps show the updated picture of refugee trends in 2011 as published in the UNHCR report this week (which also saw the commemoration of World Refugee Day “dedicated to raising awareness of the situation of refugees throughout the world“. The two maps use the total numbers for ‘refugees and people in refugee-like situations’ according to their country of origin and destination. Excluded in these maps are those refugees whose origin is unknown or who are stateless:

Landmines
In a report released by the Landmine Monitor it is stated that landmine use is ‘highest since 2004’ despite record clearances. While with Burma (Myanmar), Israel, Lybia and Syria, four of the 20% of countries who did not sign an international treaty to stop the use of land mines, continued to use new devices this year (and further armed groups in countries such as Afghanistan, Colombia and Pakistan also laid new mines, as reported by the BBC), the deadly impact of these weapons reaches further than those countries. Continue reading