
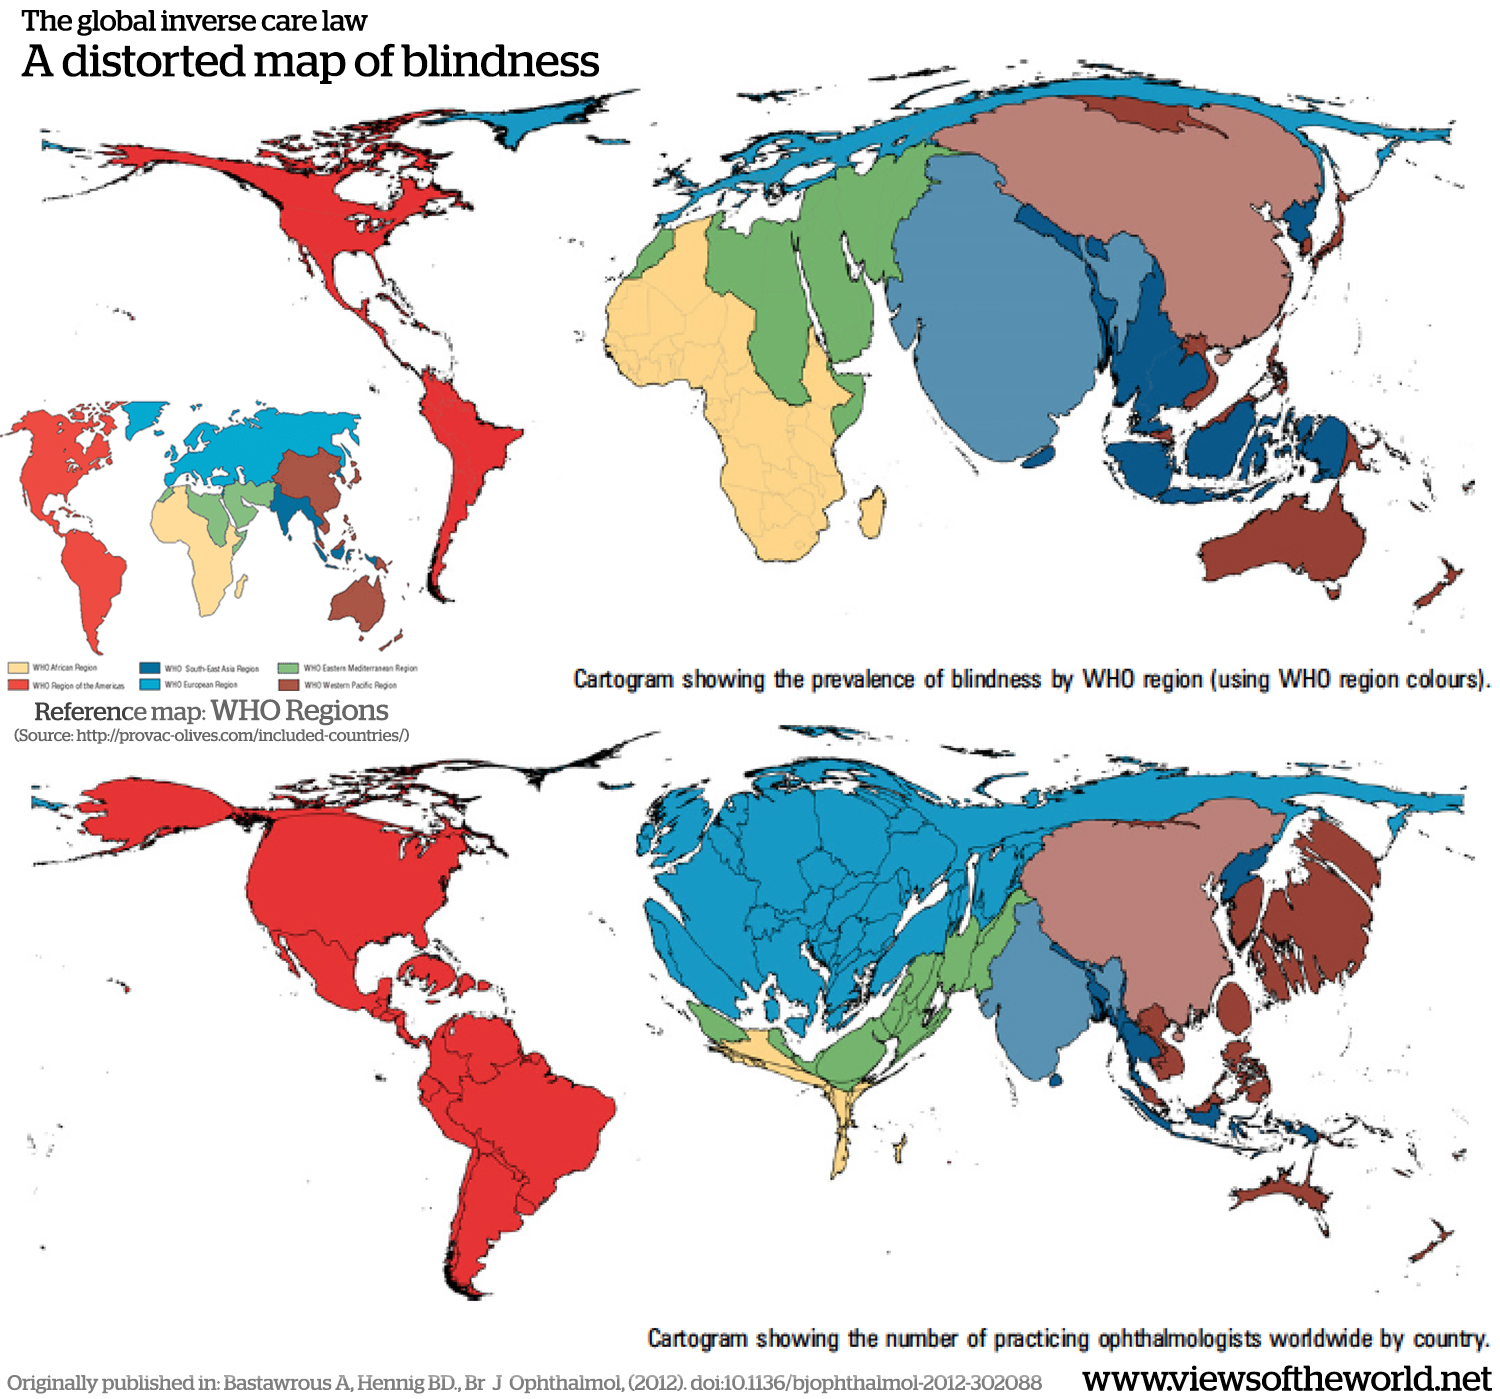
“Eye care for all” is the motto of this year’s World Sight Day. But there are stark global inequalities in access to eye care. In 1971, Hart described the, ‘Inverse Care Law’ as the availability of good medical care varying inversely with the need for it in the population served. Hart was describing the situation in the National Health Service in Great Britain at the time in which he practiced as both a General Practitioner and an epidemiologist.
Two recently published articles demonstrate the ‘Inverse Care Law’ on a global level. The prevalence of blindness worldwide in 2010 was reported by the WHO and verified that low- and middle-income countries, as expected, have the highest prevalence of blindness and visual impairment. In stark contrast to this, a more recent report describes the,“Number of ophthalmologists in training and practice worldwide” providing global data for the number of ophthalmologists per county and demonstrates that despite a growing number in practice the gap between need and supply is widening.
The situation is also magnified within individual countries of high, middle and low-income. For example, in France, an inverse correlation was found between the number of ophthalmologists and the prevalence of low vision for subjects of similar age and socio-professional category and another example is in Kenya where of the 86 practicing ophthalmologists, 43 are based in Nairobi (personal correspondence). That equates to 50% of the countries ophthalmologists serving 8% of an already underserved population.
We have developed two cartograms to depict the data from these two papers using Gastner & Newman diffusion-based method. This allowed us to create density-equalised maps based on the absolute values provided in the papers. In the maps, each of the reference areas (WHO regions and countries) is resized according to these values. Larger areas represent higher numbers and smaller areas proportionally smaller data values:
Category Archives: publications
In Focus: May 2015 – A Climate Change in UK Politics
 Following the full cartographic roundup of this year’s general election earlier this week, here comes a related piece of research. In an article for the “In Focus” section of Political Insight (September 2015, Volume 6, Issue 2) Danny Dorling and I plotted the geography of an unexpected Conservative General Election victory.
What happened of most importance in 2015 was the rapid acceleration of a trend that has been underway in UK voting since 1979 and can be seen as having its origins in the 1960s: the increasingly uneven spread of Tory voters. The graph shows the minimal proportion of Conservative voters who would have to move seat within Britain if the Conservatives were to have an even distribution of the vote in that part of the UK at each and every General Election held between 1915 and 2015. In 2015 that proportion peaked at 19.9 per cent. When the UK becomes more polarised social pressures rise, people begin to separate more and more in their views, incomes and locations.

Global Mobile Phone Users: A Decade of Changes
A global shift in predominance of mobile/cell phone ownership in the last decade has seen low-income countries reach near ubiquitous levels. Using 11 years of compiled census data from each country worldwide, Andrew Bastawrous, Iain Livingstone and I analysed the global picture of cell phone ownership and used density-equalizing cartograms to depict this change. This cartogram animation shows a decade of change in the use of mobile phones:

Anthropocene Worlds
The effects of humans on the global environment are perceived to be so significant by some scientists that they argue humans have become a major driving force in environmental change on a par with the forces of nature. It is this rapid impact that has led some geologists to unofficially name (but not, as yet, officially recognise) this very recent period of the earth’s history as the Anthropocene.
Putting criticism and disputes over the geologic validity of this idea aside, the effects of human population and economic development as part of the processes of globalisation influence the natural environment as much as the natural environment previously determined the existence of human life across the globe. One part of our footprint are the major communication and transport infrastructure links that shape the human planet.

Global Gender Inequality
The unequal treatment of individuals based on their gender is a deeply rooted problem in most societies. It started becoming an important part of academic research in the 1980s. The issue of gender inequality also became in various measures part of the Human Development Index (HDI), the annual report by the United Nations Development Programme (UNDP), and was eventually integrated as the Gender Inequality Index (GII) in the 2010 report. It is designed to measure the loss of achievement within a country caused by gender inequality.

Earthquake risk zones: A people’s perspective
Featured
In a paper for the Journal of Maps published in 2014 I have analysed and visualised data documenting earthquakes that have occurred since 2150 BC. The following map was part of the material supplementing the publication showing the results of the analysis shown on an equal population projection. The gridded cartogram gives every person on the planet an equal amount of space while highlighting the most densely populated spaces in relation to the earthquake risk (calculated via the intensity of earthquakes recorded since 2150 BC). Also shown are the world’s megacities (over 5 million population). The map shows the large populations that make even Nepal (with its almost 28 million people) much more visible than it would be on a conventional map, highlighting why this event turns out to be quite disastrous. The map also shows what the USGS statement above mentions that Nepal is amongst the areas in the region which are far less subject to major earthquakes (as indicated by the yellow to blue shading in the map there):

(click for larger version)
Download as poster (PDF, 62MB)