Recent research shows that increasing shortages in honeybees threaten pollination of crops in Europe. Although according to a study covering 41 European countries the overall number of honeybee stocks has increased by 7 per cent between 2005 and 2010 (to an estimated 13.4 million colonies with 7 billion honeybees), 15 countries have also experienced declines ranging from 4 per cent in Slovenia to 47 per cent in Switzerland. At the same time have changes in agricultural practices led to considerable changes in the need for pollination. Increases in pollinated crop areas are contributed to the growth of areas for producing biofuel crops (oilseed rape, sunflower and soybean), as have the use of pesticides led to a decline in the number of bees.
Tag Archives: environment
Earth Overshoot Day: Humanity’s Footprints
Featured
This year July, 29th is Earth Overshoot Day: “Earth Overshoot Day marks the date when humanity’s demand for ecological resources (fish and forests, for instance) and services in a given year exceeds what Earth can regenerate in that year. We maintain this deficit by liquidating stocks of resources and accumulating waste, primarily carbon dioxide in the atmosphere.”
Earth’s ability to sustain humanity’s existence is linked to the planet’s productivity and its biological capacity. In the wider sense, this does not only refer to the resources that humans consume, but also nature’s capability to absorb and regenerate the waste that we produce. With a still growing population as well as an increasing use of natural resources, biocapacity is under constant pressure. On a sustainable planet, all of humanity would only use the resources and produces waste at a level that does not deplete nature.
Have I got news for you
You may have noticed a slowdown in updates here on my website. I have been putting a lot of effort into the new Worldmapper website in recent months (check it out, it also has its own cartogram blog). Since Views of the World as well as Worldmapper are spare time projects and not my ‘real’ work, this website here gets a bit less attention, though I have not entirely abandoned it. Make sure to visit again, I will most definitely continue to post updates here as well that don’t fit in what we are doing over on Worldmapper. And also visit Worldmapper, we have a lot of exciting things lined up there!
All the latest stuff that I am up to can also be followed on Twitter: @geoviews
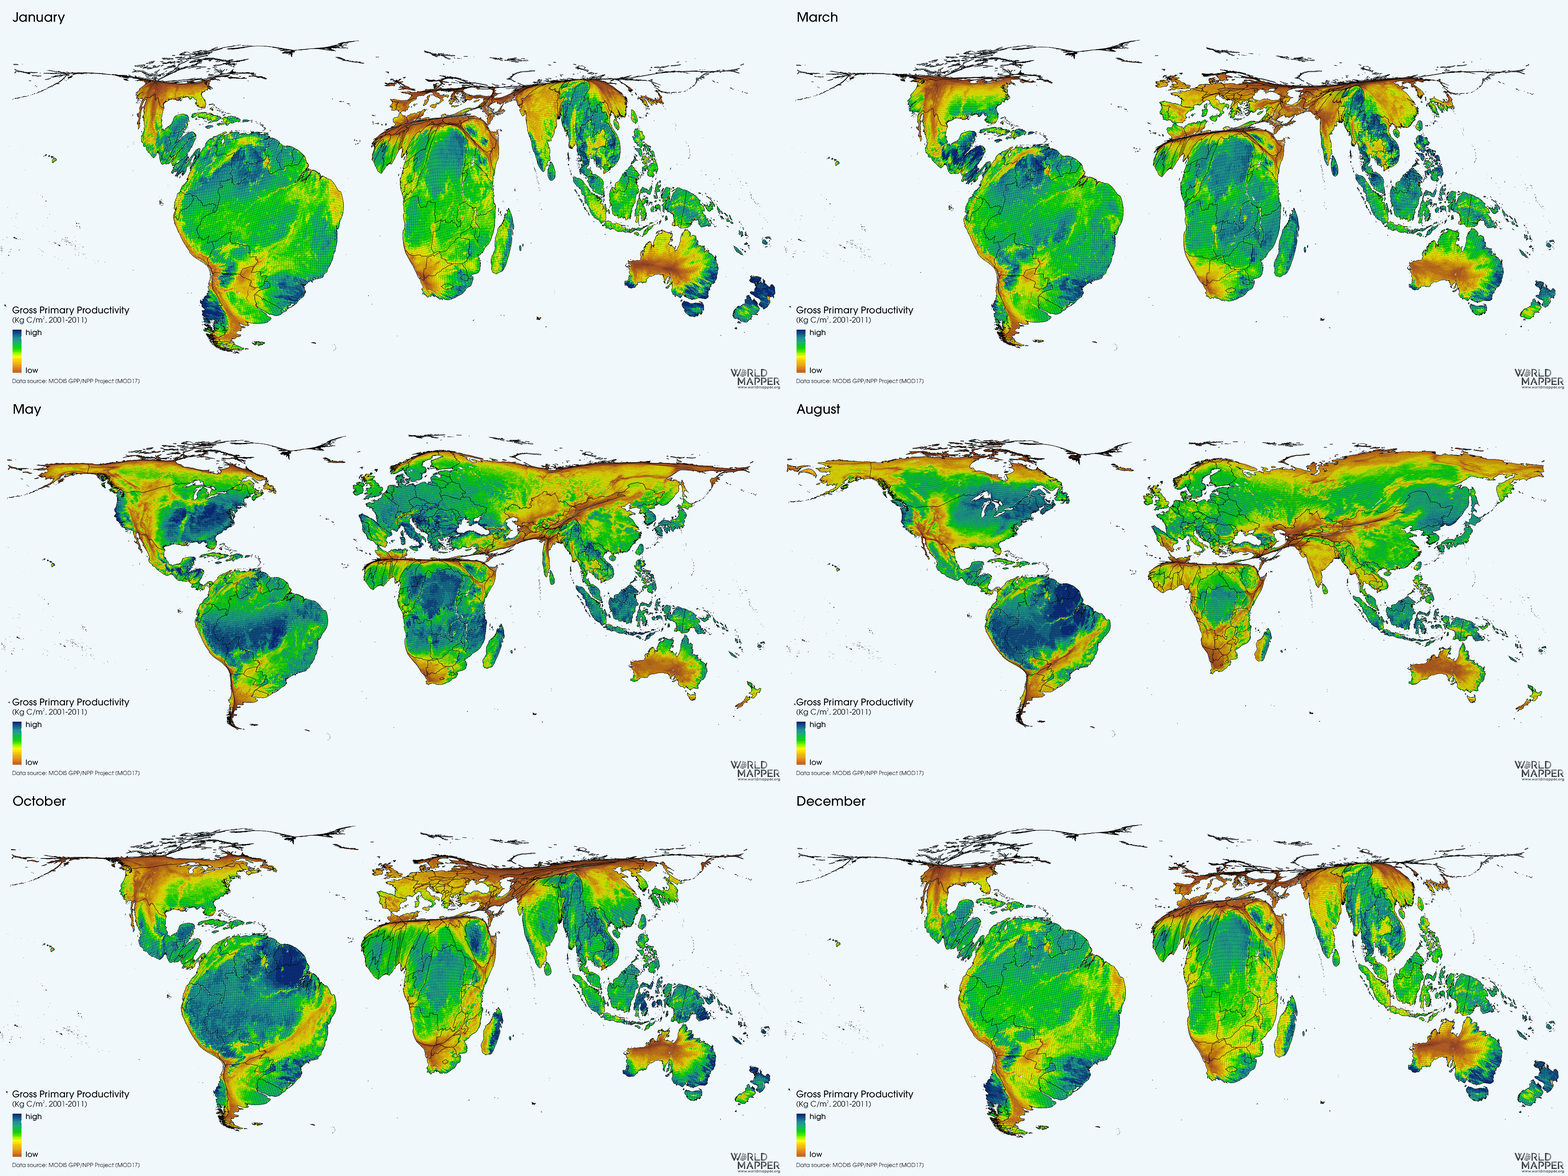
P.S.: Just so that you know what stuff in going on at Worldmapper, here is a recent map showing the heartbeat of nature (as produced by the terrestrial biosphere).
The Great Thaw: Mapping Arctic Sea Ice Thickness
Sea ice can be described as frozen seawater floating on the surface of the polar oceans. It does not include icebergs or ice shelves, as these are originating from glaciers, rather than sea water. Sea ice becomes thickest and most widespread over the respective winter months in each hemisphere, covering the oceans around the Arctic and Antarctic with millions of square kilometres of ice. It melts when the seasons change, but in the Arctic large areas remain covered all year around, while Antarctic sea ice melts away over the summer in the southern hemisphere.
Renewable Energy
Renewable energy is defined as ‘energy from a source that is not depleted’. Main sources include biomass, hydropower, wind, biofuels, solar, heat pumps, biogas, geothermal, and marine (such as tidal power). Data by the International Energy Agency sees the share of renewable energy in global power generation at 22 per cent in 2013, with an estimated increase to 26 per cent by 2020 as a result of supportive policies by a large number of governments.
Storm Spaces
Tropical cyclonic systems are generally referred to as tropical storms. They are better known by their regional names, such as hurricanes in the Caribbean and North America, or typhoons in parts of Asia. They form near the equator over larger bodies of warm waters that evaporate from the ocean surface and fuel these emerging storm systems. Their strong winds and heavy rainfalls frequently become part of our news as they often put large numbers of human livelihoods at risk.
Recent studies show that the number of tropical cyclones (as well as tropical cyclone intensity) over the past decades has increased. Tracks of tropical storms collected over a longer period can indicate where such storms occur most frequently. The records used in this issue’s visualisation covers data from 1945 to 2008.


