Have I got news for you

You may have noticed a slowdown in updates here on my website. I have been putting a lot of effort into the new Worldmapper website in recent months (check it out, it also has its own cartogram blog). Since Views of the World as well as Worldmapper are spare time projects and not my ‘real’ work, this website here gets a bit less attention, though I have not entirely abandoned it. Make sure to visit again, I will most definitely continue to post updates here as well that don’t fit in what we are doing over on Worldmapper. And also visit Worldmapper, we have a lot of exciting things lined up there!
All the latest stuff that I am up to can also be followed on Twitter: @geoviews

P.S.: Just so that you know what stuff in going on at Worldmapper, here is a recent map showing the heartbeat of nature (as produced by the terrestrial biosphere).

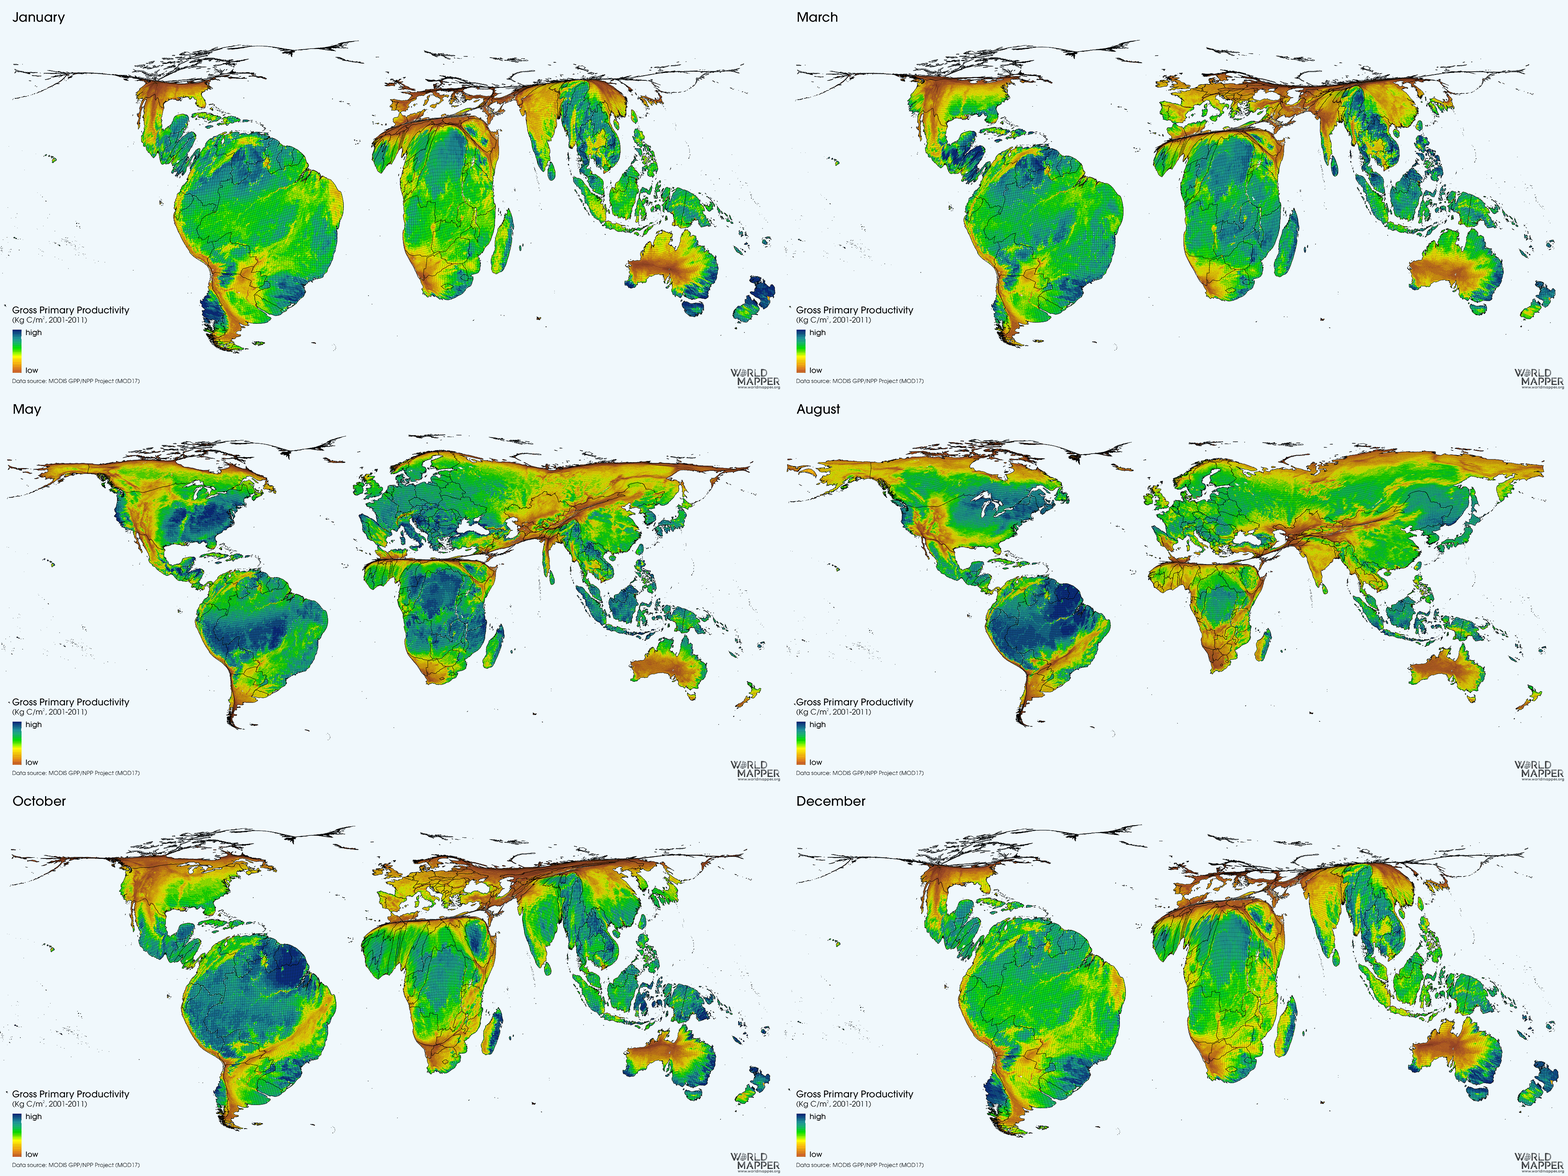
Nature's Heartbeat

Mapping the Anthropocene

Featured

The effects of humans on the global environment are perceived to be so significant by some scientists that they argue the onset of industrialisation (in the eighteenth century) has been a major driving force in environmental change on a par with the forces of nature. It is this rapid impact that has led some geologists to unofficially name (but not, as yet, officially recognise) this recent period of the earth’s history (from around 1760-onwards) as the Anthropocene (roughly translating as the era – or epoch – shaped considerably through the actions of humanity).

The Human Planet: Gridded Population Cartogram
Gridded population cartogram displaying the topography of the world in relation to the population distribution (click here for larger version)

Continue reading

Soils of the World

International Year of SoilsHealthy Soils for a Healthy Life is the motto of the UN International Year of Soils which aims to “increase awareness and understanding of the importance of soil for food security and essential ecosystem functions.” As explained on the campaign’s website, “soil is the thin layer of material on the Earth’s surface. It is a natural resource consisting of weathered and organic materials, air and water. As it is the medium in which plants establish themselves and grow, the most widely recognized function of soil is its support for food production. Soil provides nutrients and water that are absorbed through plant roots and contribute to the regulation of water and atmospheric gases and therefore play an important role in climate regulation.”
Soil therefore matters most where is is near human population, which at the same time puts soils under extreme pressure in these areas. Soil types not least determine where humans used to settle when they gave up their nomadic lifestyles and started becoming more stationary as farmers. Nowadays, some of the most fertile soils are found in the most densely populated spaces on the planet, which is shown in the following map. The map shows the major soil types classified in the FAO/UNESCO Soil Map of the World reprojected on a gridded population cartogram where a grid is resized to give every person living within a grid cell an equal amount of space (reducing the map in those spaces most where there are fewest people):

Map of major soil groups
(click for larger version)

Continue reading

Water worlds: Ocean Chlorophyll levels

Featured

The ocean is the last frontier that has not been discovered by cartogram techniques before. As such, it was an inevitable step in my PhD research some years ago to test the creation of a gridded ocean cartogram, a cartogram that is limited to the extent of the world’s oceans (also linking nicely to my past research on coastal ecosystems).
Chlorophyll concentrations in the world’s oceans are important indicators for the presence of algae and other plant-like organisms that carry out photosynthesis. As such, phytoplankton (which contains the chlorophyll) is an essential element of the food chain in the seas as it provides the food for numerous animals. Variations and changes in the chlorophyll levels are also relevant for the study of the ecology of the sea. Changing chlorophyll levels can indicate changing sea temperatures and other conditions in the oceans that cover about 72 percent of the planet’s surface.

Gridded cartogram visualisation of Ocean Chlorophyll concentrations
(click for larger version)

Continue reading

Hyperspectral remote sensing and analysis of intertidal zones

The growing amount of remotely sensed data and the ongoing developments in the improvement of spatial and spectral resolutions lead to high expectations. These often inflated expectations are usually not fulfilled. I explored these expectations and aimed to make a contribution to bring them to a more accurate level in research in the field of hyperspectral image analysis of small scale and heterogeneous biotopes in the intertidal zones of coastal areas which I undertook back at my time at the University of Cologne and the Alfred Wegener Institute for Polar and Marine Research Bremerhaven. Here are some insights from my work.

Map overview of the Study Areas on Helgoland and Sylt
Overview of the study area on the islands of Helgoland and Sylt, Germany
(click for larger version)

Continue reading

Global tree cover

There is a long tradition in the emotional relationship between people and forests. We can get an understanding of the extent of the global tree cover from satellite sensors such as NASA’s MODIS
Calculating the average tree cover in an area allows us to estimate the extent of the world’s forests. Forest landscapes can be mapped in various ways and is often done in conventional maps. However, much of the land area is not covered by forest and the few remaining untouched forest landscapes keep shrinking while deforestation continues.

Gridded cartogram visualisation of global tree cover
(click for larger version)

Continue reading