Have I got news for you

You may have noticed a slowdown in updates here on my website. I have been putting a lot of effort into the new Worldmapper website in recent months (check it out, it also has its own cartogram blog). Since Views of the World as well as Worldmapper are spare time projects and not my ‘real’ work, this website here gets a bit less attention, though I have not entirely abandoned it. Make sure to visit again, I will most definitely continue to post updates here as well that don’t fit in what we are doing over on Worldmapper. And also visit Worldmapper, we have a lot of exciting things lined up there!
All the latest stuff that I am up to can also be followed on Twitter: @geoviews

P.S.: Just so that you know what stuff in going on at Worldmapper, here is a recent map showing the heartbeat of nature (as produced by the terrestrial biosphere).

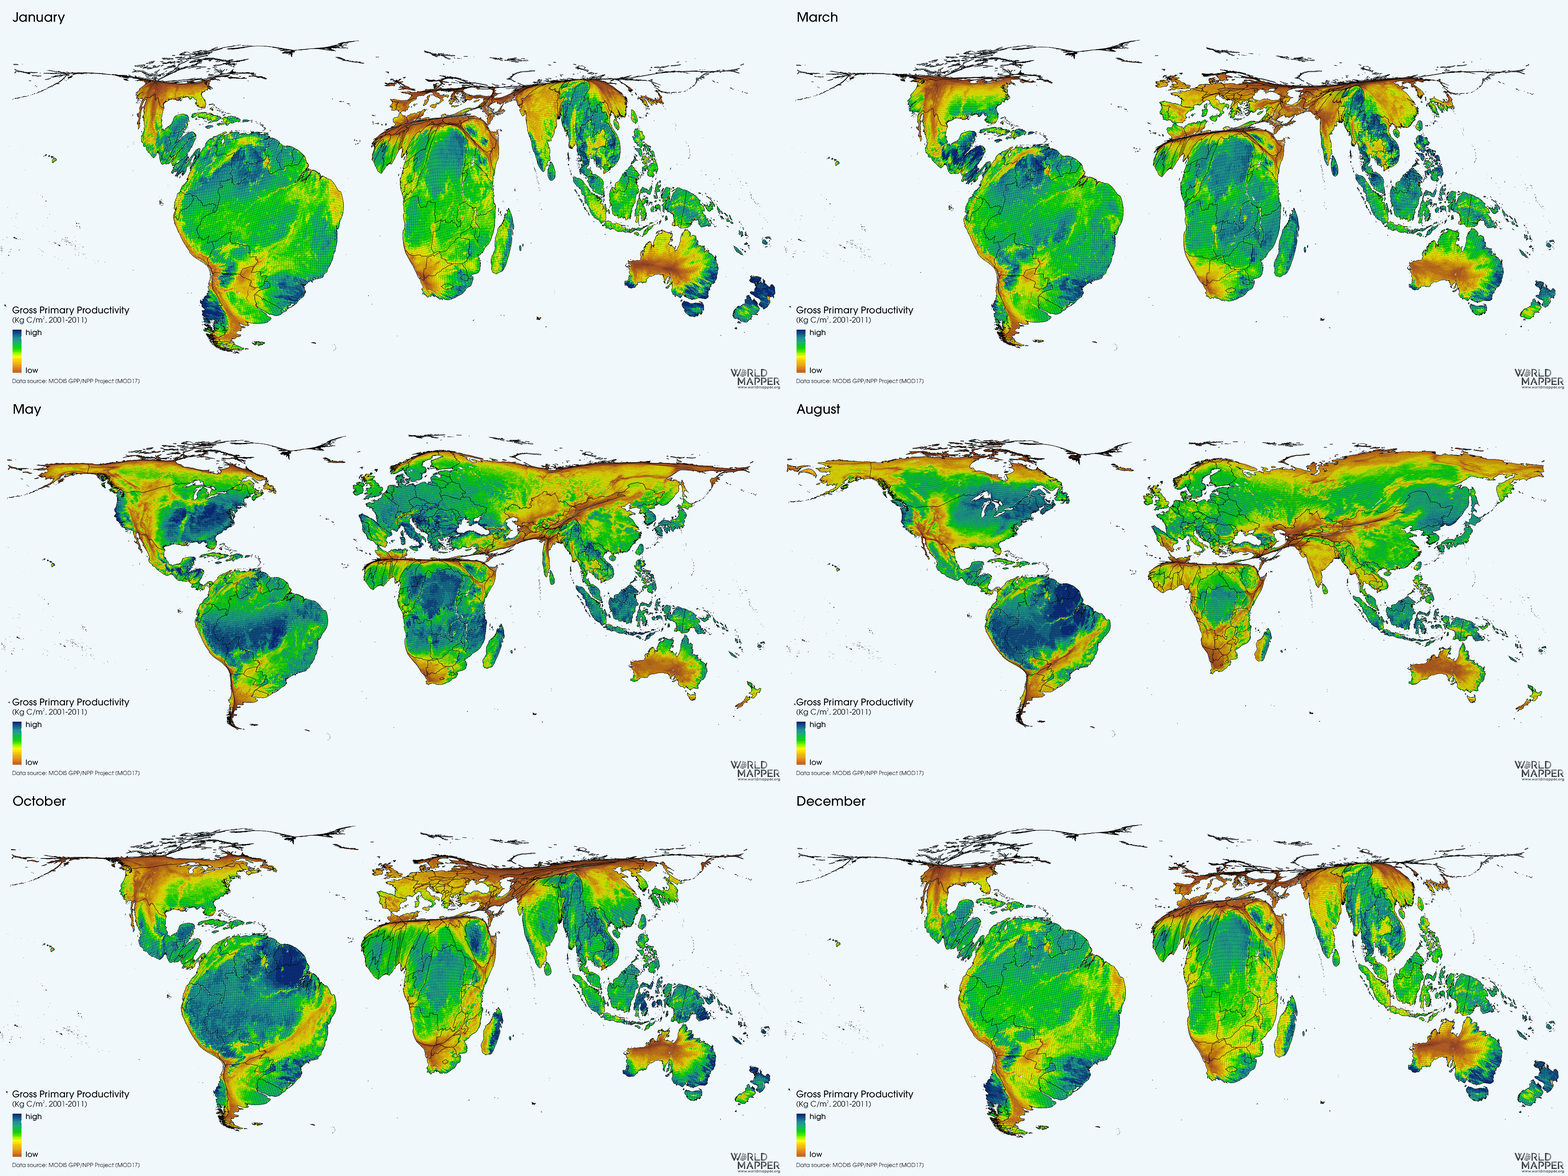
Nature's Heartbeat

Destination: Iceland

1,767,726 people have visited Iceland through Keflavik Airport in 2016. These statistics from the Icelandic Tourism Board (Ferðamálastofa) confirm that there has been an exponential growth in tourism to the country. Six years ago, when this latest growth really started after the infamous Eyjafjallajökull eruption. It looks as if this incident triggered a new wave of tourism, Inspired by Eruptions?, further fueled by new flights not only from established European mostly low cost carriers but also from the new Icelandic carrier Wow air founded in 2011. Globally successful movies and TV series further helped putting Iceland on the map of the global tourism industry.

Tourism in Iceland 1949-2016
(click for larger version)

Continue reading

Warped worlds

W wie WissenIn 2013 German public broadcaster ARD made a documentary film about my work for their science programme W wie Wissen. This also features a range of cartogram visualisations that I produced for them. The following clip shows a compilation of the map animations that were shown in the feature, giving an impression of some of the cartographic works and visualisations that I have been working on over the past couple of years: Continue reading

Rising high: A brief history of the housing market

House price monopoly would be a better name for what has turned into a defining political issue ahead of the 2015 general election. As the ONS states in its latest release of long-term housing sales data, “the average price of sold houses in England and Wales has more than doubled since 1995” and “nearly a million properties were sold in 2013.” The dynamics of the housing market is about more than people looking for a place to live. It has become a substantial part of the British economy.
The following cartogram animation puts this trend into a vivid perspective. It shows the absolute value of all housing stock sold in a year for the regions of England as well as the boroughs of London, which itself becomes ever more dominant over the past two decades. Only in economic weaker times it loses some of its pace compared to the rest of England, but stays way ahead of any other region. The animation also takes the absolute value displayed in each map into account by resizing England according to the total value represented in each map, so that the full cartogram itself grows (and shrinks after the crash in 2008) over time:

Cartogram animation of sold housing value from 1995 to 2014
(click for larger version)

Continue reading

Have you ever seen the rain?

The 20th session of the Conference of the Parties and the 10th session of the Conference of the Parties serving as the Meeting of the Parties to the Kyoto Protocol is held from 1 to 12 December. For COP 20 / CPM 10 delegates from around the world increased their carbon footprint by heading to Lima, Peru, to hopefully produce more than just hot air. So again it is time to speak about the weather…or climate.

Animation of a gridded cartogram projection of global annual precipitation patterns
(click for larger version)

This animation is a visualisation which I originally produced for my PhD research and which was published in my book Rediscovering the World. Continue reading

Londonmapper goes #geomob: Visualising London with Cartograms

Today I was invited to give a presentation at the quarterly #geomob meetup for location based service developers which this time took place at the Google Campus in East London. In my talk I gave a short preview of the Londonmapper project that I am working on with my colleagues and the Trust for London. Unfortunately technology played some tricks on us and some of the animated bits and content did not show up during the presentation, so that I promised to put these on my blog alongside the slides of the talk. Here we go…
This first animation was an introduction into showing how cartograms work in general. I used a gridded population cartogram animation for Great Britain which I created years ago, demonstrating the approach of using a gridded cartogram to allow other layers being used in the transformed map. The following map (which is rather drafty as it was only a conceptual exercise) shows Great Britain overlaid with a topographic layer indicating the land elevation, as well as some key rivers and a selection of the motorway network. During the animation this map transforms from a conventional land area map into a gridded population cartogram where each grid cell is resized according to the total number of people living there. While the grid cells change their size, the other geographic layers are changed accordingly, so that the final cartogram shows these layers in relation to the population distribution, i.e. at which elevations do people live and how are people linked to major roads. The animation also demonstrates the magnifying lens effect in the most densely populated areas. Motorways and even the curvy shapes of the river Thames become visible now which at such a scale cannot be seen from a normal map. Gridded cartograms hence help to highlight details in these areas that are most relevant in the transformed space.

Gridded Cartogram Animation of Great Britain
(click for larger version)

Continue reading