The 2018 Winter Olympic Games in PyeongChang have come to an end. Branded as the ‘Games of new horizons’, they were as much about politics as they were about actual sports. The following cartogram series focuses on the sports side of the games, showing the distribution of medals that were awarded during the games. The maps show each country resized according to the number of medals received by each country (with the Olympic Athlete from Russia shown as Russia):
Tag Archives: statistics

Destination: Iceland
1,767,726 people have visited Iceland through Keflavik Airport in 2016. These statistics from the Icelandic Tourism Board (Ferðamálastofa) confirm that there has been an exponential growth in tourism to the country. Six years ago, when this latest growth really started after the infamous Eyjafjallajökull eruption. It looks as if this incident triggered a new wave of tourism, Inspired by Eruptions?, further fueled by new flights not only from established European mostly low cost carriers but also from the new Icelandic carrier Wow air founded in 2011. Globally successful movies and TV series further helped putting Iceland on the map of the global tourism industry.

Rio 2016: Medals vs Athletes

Alternative ways of presenting the results of the Olympics has become more popular in recent years. Google – as other media outlets – did alternative medal counts allowing you to rank the medals not by their absolute numbers, but by other indicators such as population, GDP, or even more quirky themes such as fans or healthy eating. Continue reading
EU Referendum Statistics
“Sanity is not statistical.” The political rhetoric in the aftermath of the EU referendum in the United Kingdom has brought us closer to Orwell’s infamous state of Airstrip One then one could have possibly envisaged. Each side of the debate twists and turns the statistics and ‘facts’ to keep supporting their argument, while neither political party has yet managed to end the political stalemate in the country, which finds itself in a state of ‘post-truth democracy‘ that it slowly entered during the pre-referendum campaigns. All sides claim what can be best explained with the German word ‘Deutungshoheit’ (a form of prerogative of interpreting the numbers behind the result as the ultimate truth). The real truth perhaps is that there is no truth, and the deeper you delve into the results, the more complexity you find. So here are some more less-talked about findings that emerge when taking a second look at the EU referendum statistics.
As mentioned in my earlier piece on mapping the referendum outcome, of all those who were allowed to vote in this referendum, 13 million people did decide not to cast their vote, which – despite the higher than currently usual turnout – is a significant number that could have made a difference in the close outcome either way. Amongst those that voted the immediate picture that emerged from the polls published after the referendum was confusing. Several polls, such as those paid for by Lord Ashcroft and used for this analysis, agreed that the older people were those who were more likely to vote for Leave, while the youngest had the largest share voting for Remain. However, when taking the total electorate into account, and considering those who – according to SkyData – chose not to vote (or spoilt their ballot), this picture became far less clear than it first seemed:

Visualising your UK constituency
The UK general election is fast approaching. Following the first almost-debate of the would-like-to-be Prime Ministers the battle for the ‘correct’ interpretation of the state of the nation has come into its final stage. Statistics are easy to twist, and there is never an absolute truth in them. In a collaboration with the Office for National Statistics I was involved in the creation of a little interactive visualisation feature that sheds light on some key statistics that show life in the constituencies around the country. Using a conventional map and a hexagon cartogram of the United Kingdom we looked at house prices, income, public sector employment, education, age, migration, and health which can be interactively explored and compared in both map views. The following map is one example from that feature, showing the share of people not born in the United Kingdom:

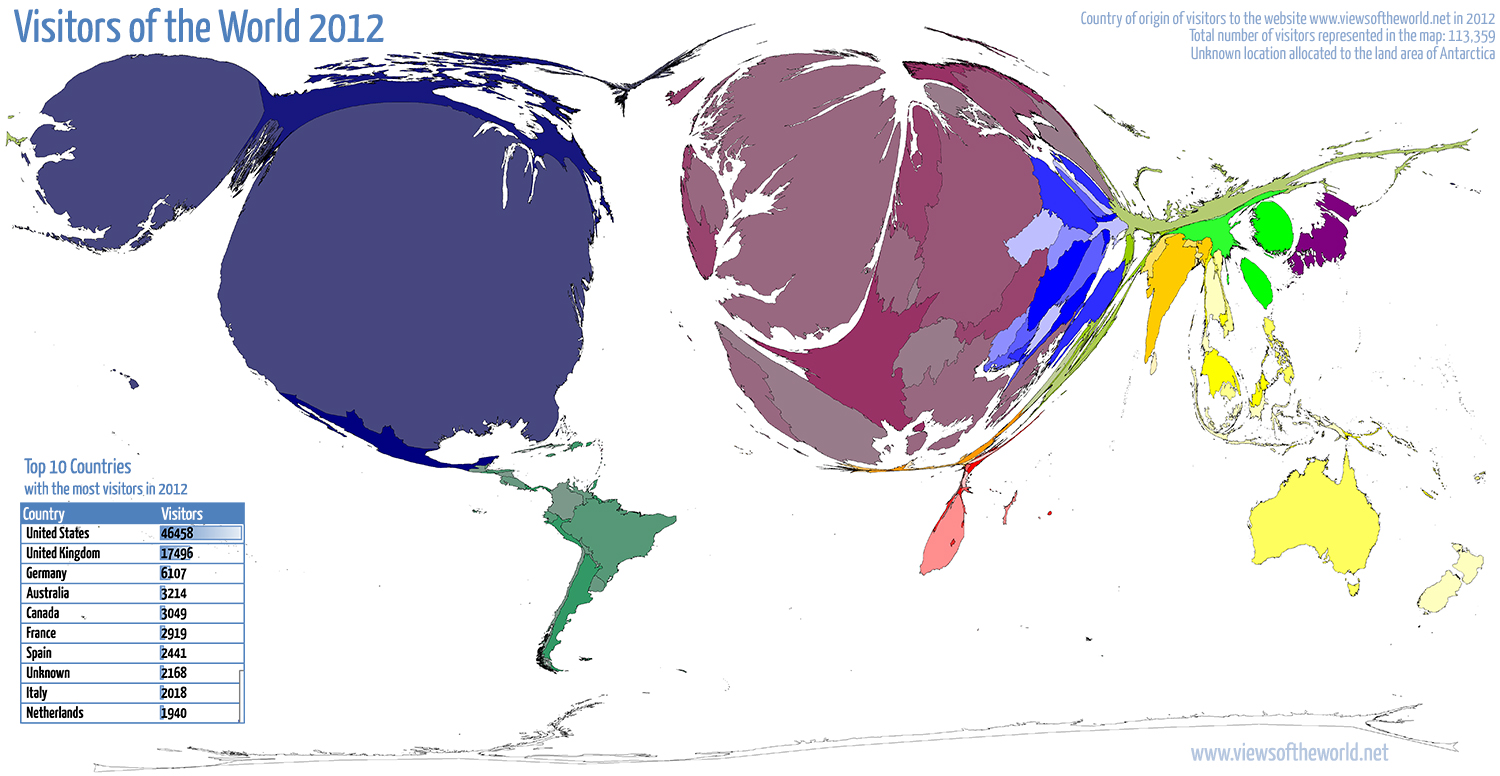
Visitors of the World 2012
2012 has been a quite busy year on this website with the number of annual visitors breaking the 100,000 mark for the first time. The analytics tool Piwik which I use for monitoring my website counted precisely 113,359 visits in 2012, up from almost 90,000 the year before. So thanks everyone for visiting either once (as 85,000 people did) or as one of the 16,800 more regular visitors. This asks for a new map that’s showing, where each of the counted visits came from last year: 176 individual countries were counted, as well as a larger number of unknown origins (and of course all those who prefer blocking any analytics tool, they do not appear in any of these statistics). Despite such a large diversity of visits from around the world, the majority comes from places that one may expect, given certain characteristics of this website (language, location, etc.), and also given the accessibility of the internet, which until today remains a very unequal story, even if availability of the online world slowly finds its way to the less privileged places on this planet. But I digress, so here is the map of all visits to viewsoftheworld.net in 2012: