Visualising Urban Agglomerations in Germany

Read/cite the original publication here:
Hennig, B.D. (2018): The growth and decline of urban agglomerations in Germany. Environment and Planning A: Economy and Space. DOI:10.1177/2F0308518X18798835

Continue reading

The global inverse care law: a distorted map of blindness

“Eye care for all” is the motto of this year’s World Sight Day. But there are stark global inequalities in access to eye care. In 1971, Hart described the, ‘Inverse Care Law’ as the availability of good medical care varying inversely with the need for it in the population served. Hart was describing the situation in the National Health Service in Great Britain at the time in which he practiced as both a General Practitioner and an epidemiologist.
Two recently published articles demonstrate the ‘Inverse Care Law’ on a global level. The prevalence of blindness worldwide in 2010 was reported by the WHO and verified that low- and middle-income countries, as expected, have the highest prevalence of blindness and visual impairment. In stark contrast to this, a more recent report describes the,“Number of ophthalmologists in training and practice worldwide” providing global data for the number of ophthalmologists per county and demonstrates that despite a growing number in practice the gap between need and supply is widening.
The situation is also magnified within individual countries of high, middle and low-income. For example, in France, an inverse correlation was found between the number of ophthalmologists and the prevalence of low vision for subjects of similar age and socio-professional category and another example is in Kenya where of the 86 practicing ophthalmologists, 43 are based in Nairobi (personal correspondence). That equates to 50% of the countries ophthalmologists serving 8% of an already underserved population.
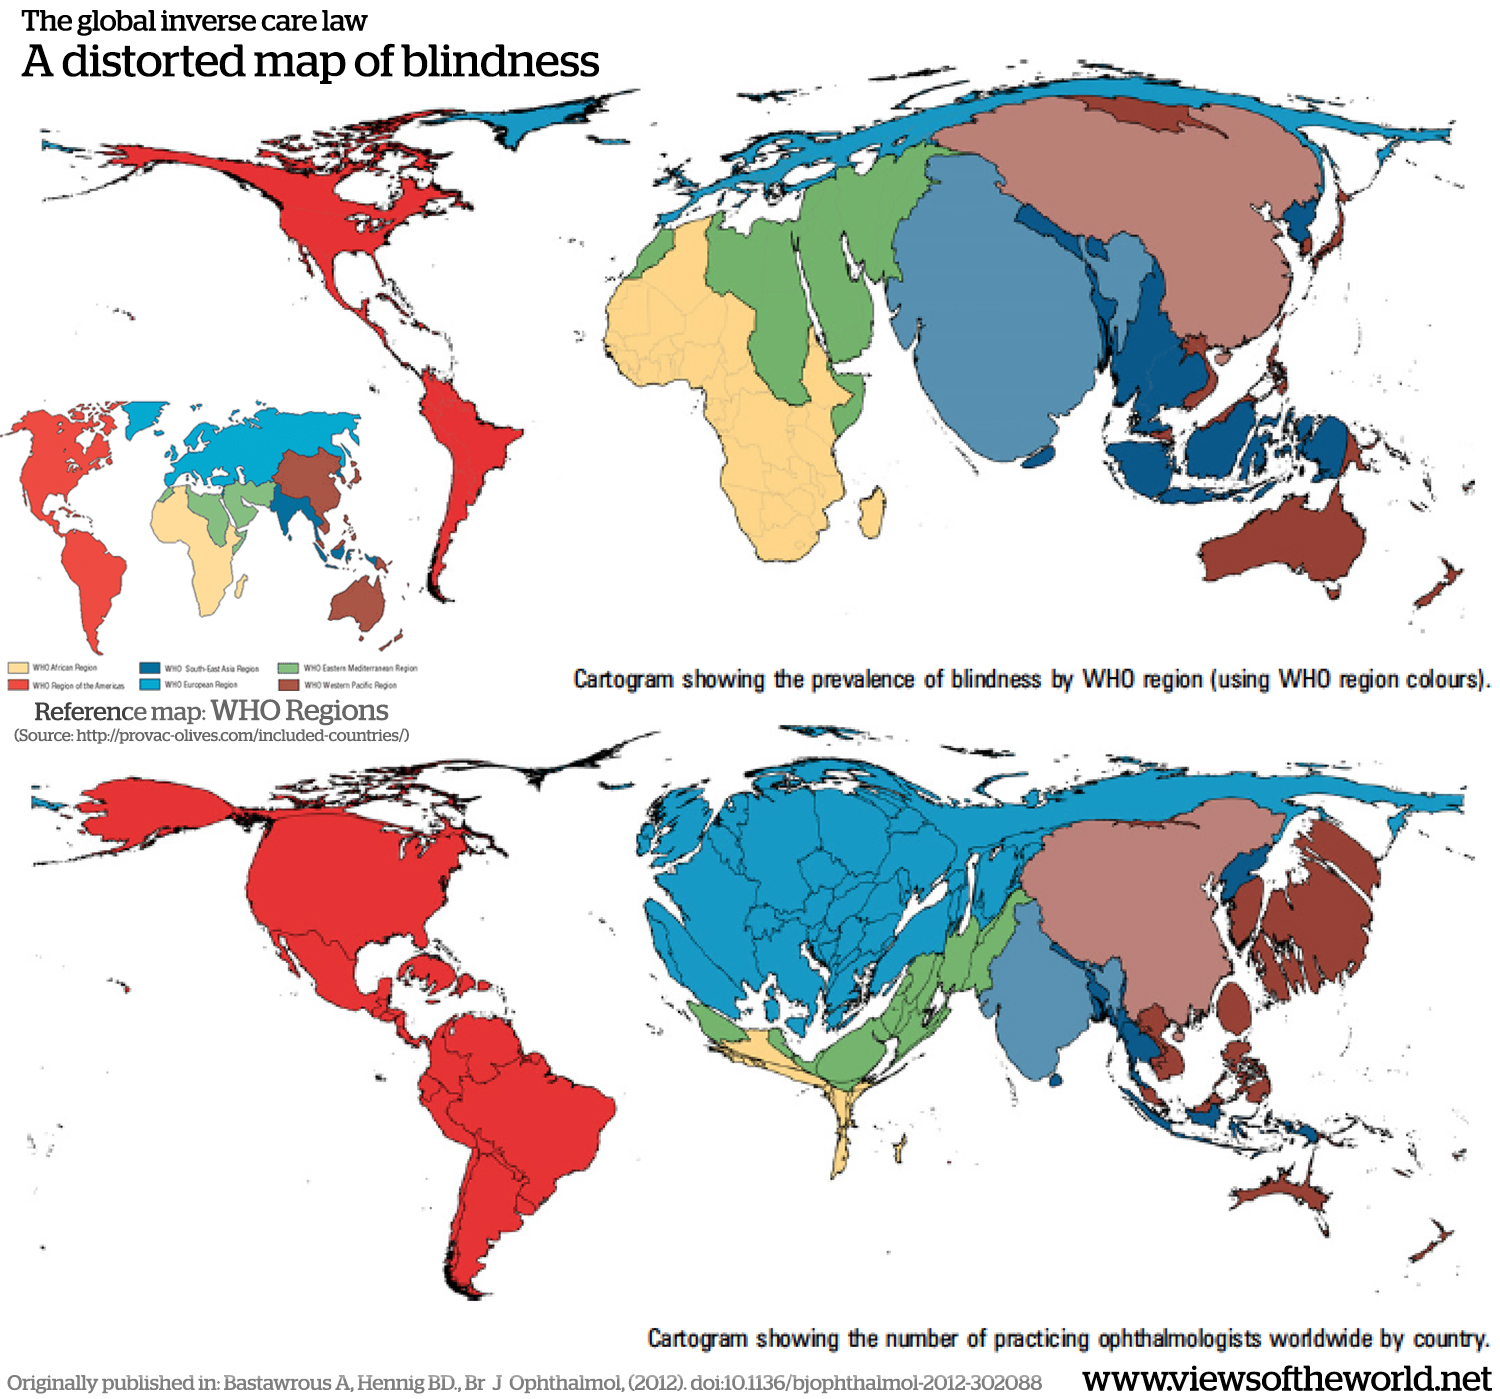
We have developed two cartograms to depict the data from these two papers using Gastner & Newman diffusion-based method. This allowed us to create density-equalised maps based on the absolute values provided in the papers. In the maps, each of the reference areas (WHO regions and countries) is resized according to these values. Larger areas represent higher numbers and smaller areas proportionally smaller data values:

Cartograms of Blindness and Opthmamologists
(click for larger version)

Continue reading

“Calling Abidjan” – estimating population distribution through analysis of mobile phone call data records

Big data, big challenge? Together with Harald Sterly of the University of Cologne I presented a little piece of research in the Extended Spatial Analytics session of the German Geography Congress (Deutscher Kongress für Geographie) in Berlin. The project “Calling Abidjan” that we worked on with Kouassi Dongo of Université de Cocody-Abidjan was started after we successfully applied for participation of the D4D Challenge. According to the initiator Orange telecommunications ‘Data for Development’ is “an innovation challenge open on ICT Big Data for the purposes of societal development”. The project allowed us to work with anonymised mobile phone data from individual call records by Orange in the country of Côte d’Ivoire (Ivory Coast).
We were interested in investigating, what non-computer scientists with a social science and urban planning background can do with such data in a more contextual rather that technically driven way and therefore explored how mobile phone call records can be used to better estimate population distribution.
For our analysis we used anonymised call data records consisting of information about the base station, timestamp, and caller ID produced by the approximately 500.000 Orange Télecom users in the country. There were 1079 base stations at the time the data was generated and we were able to work with data covering 183 days. The dataset consisted of 13GB of raw data which some would perhaps call ‘Big Data’ (though I personally do not like this term for many reasons).
The following two (draft) maps give an insight into the results. The purple circles show the distribution and density of population estimates that we derived using only mobile phone call records dataset. To better see the correlation with what other population data tells us about where people live, we did not only produce a normal land area map (on the left, also displaying some basic idea of the topography in the country) but also showed the data on a gridded population cartogram which we generated from the LandScan population grid, the perhaps most detailed population dataset currently available on a globally consistent high-resolution basis:

Population maps of Ivory Coast / Côte d'Ivoire created using Mobile Phone Call Records
(click for larger version)

Continue reading

Urbane Veränderungsprozesse in Stadtregionen Deutschlands

Read/cite the original publication here:
Hennig, B.D. (2018): The growth and decline of urban agglomerations in Germany. Environment and Planning A: Economy and Space. DOI:10.1177/2F0308518X18798835

 
This is a German-language poster contribution looking at processes of change in the major urban agglomerations in Germany and novel ways of visualising these using cartogram visualisation techniques. Continue reading

In Focus: May 2015 – A Climate Change in UK Politics

Political InsightFollowing the full cartographic roundup of this year’s general election earlier this week, here comes a related piece of research. In an article for the “In Focus” section of Political Insight (September 2015, Volume 6, Issue 2) Danny Dorling and I plotted the geography of an unexpected Conservative General Election victory.
What happened of most importance in 2015 was the rapid acceleration of a trend that has been underway in UK voting since 1979 and can be seen as having its origins in the 1960s: the increasingly uneven spread of Tory voters. The graph shows the minimal proportion of Conservative voters who would have to move seat within Britain if the Conservatives were to have an even distribution of the vote in that part of the UK at each and every General Election held between 1915 and 2015. In 2015 that proportion peaked at 19.9 per cent. When the UK becomes more polarised social pressures rise, people begin to separate more and more in their views, incomes and locations.

Continue reading

Electoral Doctrine: Thirty-nine maps of voting

The 2015 UK general election is history and many stories have been told about the unexpected victory of the Conservative party. But the picture of the election is far more diverse than it seems and the political landscapes are more polarised than a conventional map of the first votes can show.
This poster, submitted as an entry to the joint BCS-SoC ‘Mapping Together’ Conference starting tomorrow in York, presents the electoral doctrine of the 2015 election. It is a cartographic roundup of the beliefs of the electorate in thirty-nine images that tell the full story of a shift in political paradigms that will shape the debates for the elections to come:

Poster: Electoral Doctrine - 39 Maps of Voting
(click for larger version)

Continue reading