Call for Paper and Panel Contributions
The Challenges and Potentials of Contemporary Atlases
Association of American Geographer’s (AAG) Conference 2018
New Orleans, 10 – 14 April 2018
Continue reading
Tag Archives: conference
“Calling Abidjan” – estimating population distribution through analysis of mobile phone call data records
Big data, big challenge? Together with Harald Sterly of the University of Cologne I presented a little piece of research in the Extended Spatial Analytics session of the German Geography Congress (Deutscher Kongress für Geographie) in Berlin. The project “Calling Abidjan” that we worked on with Kouassi Dongo of Université de Cocody-Abidjan was started after we successfully applied for participation of the D4D Challenge. According to the initiator Orange telecommunications ‘Data for Development’ is “an innovation challenge open on ICT Big Data for the purposes of societal development”. The project allowed us to work with anonymised mobile phone data from individual call records by Orange in the country of Côte d’Ivoire (Ivory Coast).
We were interested in investigating, what non-computer scientists with a social science and urban planning background can do with such data in a more contextual rather that technically driven way and therefore explored how mobile phone call records can be used to better estimate population distribution.
For our analysis we used anonymised call data records consisting of information about the base station, timestamp, and caller ID produced by the approximately 500.000 Orange Télecom users in the country. There were 1079 base stations at the time the data was generated and we were able to work with data covering 183 days. The dataset consisted of 13GB of raw data which some would perhaps call ‘Big Data’ (though I personally do not like this term for many reasons).
The following two (draft) maps give an insight into the results. The purple circles show the distribution and density of population estimates that we derived using only mobile phone call records dataset. To better see the correlation with what other population data tells us about where people live, we did not only produce a normal land area map (on the left, also displaying some basic idea of the topography in the country) but also showed the data on a gridded population cartogram which we generated from the LandScan population grid, the perhaps most detailed population dataset currently available on a globally consistent high-resolution basis:
Into the big wide open: Think (twice) before you map!
A little bit from my archives which I never got around putting online before…here it comes: Last September I was invited to do a keynote at FOSS4G, OSGeo’s Global Conference for Open Source Geospatial Software. The event is the annual gathering of Open Source Geospatial Developers, Users and Leaders and was held at Nottingham’s new East Midlands Conference Centre, 17th to 21st September. The conference motto was ‘Geo for all’ because, as the organisers explain, “many people who work with geo software and maps find themselves becoming passionate advocates for the power of geography to make a difference: in government, business, travel, environment, crime reduction, social justice and communications to name just a few domains. Open Source Geo software makes this possible.”
So how does a geographer, working with geospatial software but being less so a developer, address a huge crowd of people who are little reluctant to see themselves as geeks and nerds? Instead of pretending to be as clever as most of the audience I took a slightly different stance, trying to bridge the gap between those on the programming side and those on the applied side – two groups which sadly rarely speak to each other. Traditional cartographers often see their field of work undermined (and threatened) by computerised methods to generate mapping products, while coders very often find the obsession with minute detail and ‘artisan’ cartography annoying. If the two worlds would come a bit closer together, and both sides speak a bit more with each other, the world of cartography and geospatial visualisations could benefit so much more. Addressing a more technical audience, I concluded that we should all think a little bit more before we start mapping, and that we should give a good mapping project a little bit more time than we often do these days – but more importantly of course: We should never stop mapping. These are the slides of my talk, of course including many maps:
From geovisualisation to neocartography: Maps in a digital world

Changing technologies have always had a considerable impact on cartography and continue to do so. Several technological revolutions marked important steps in the practice and process of creating maps. Mechanical, optical and photo-chemical technologies changed the way maps were produced. Then, the discovery of electronic capabilities made a new dimension in map production accessible: Not only most of the design techniques were transferred to digital platforms, used at some step in the production of almost all maps created today, but also the possibility to deal with huge amounts of data that can hardly be analysed by a single person enables cartographers to find ways to automate data processing for cartographic visualisation. This is where the term neocartography comes into play, which gives credit to the most recent trends in the field of map-making. Continue reading
Visualisations of a World in Crisis
Gridded Cartograms and the World Population Atlas
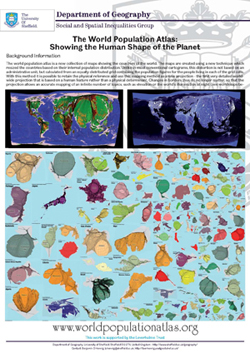
For this year’s 46th Annual Summer School of the Society of Cartographers I recalled the making of the World Population Atlas and wrapped all material up for some contributions for the meeting. The outcome are two new posters and a presentation for the delegate’s session:
 Poster: The World Population Atlas |
 Poster: Creating Gridded Cartograms |
The content on this page has been created by Benjamin Hennig. Please contact me for further details on the terms of use.


