
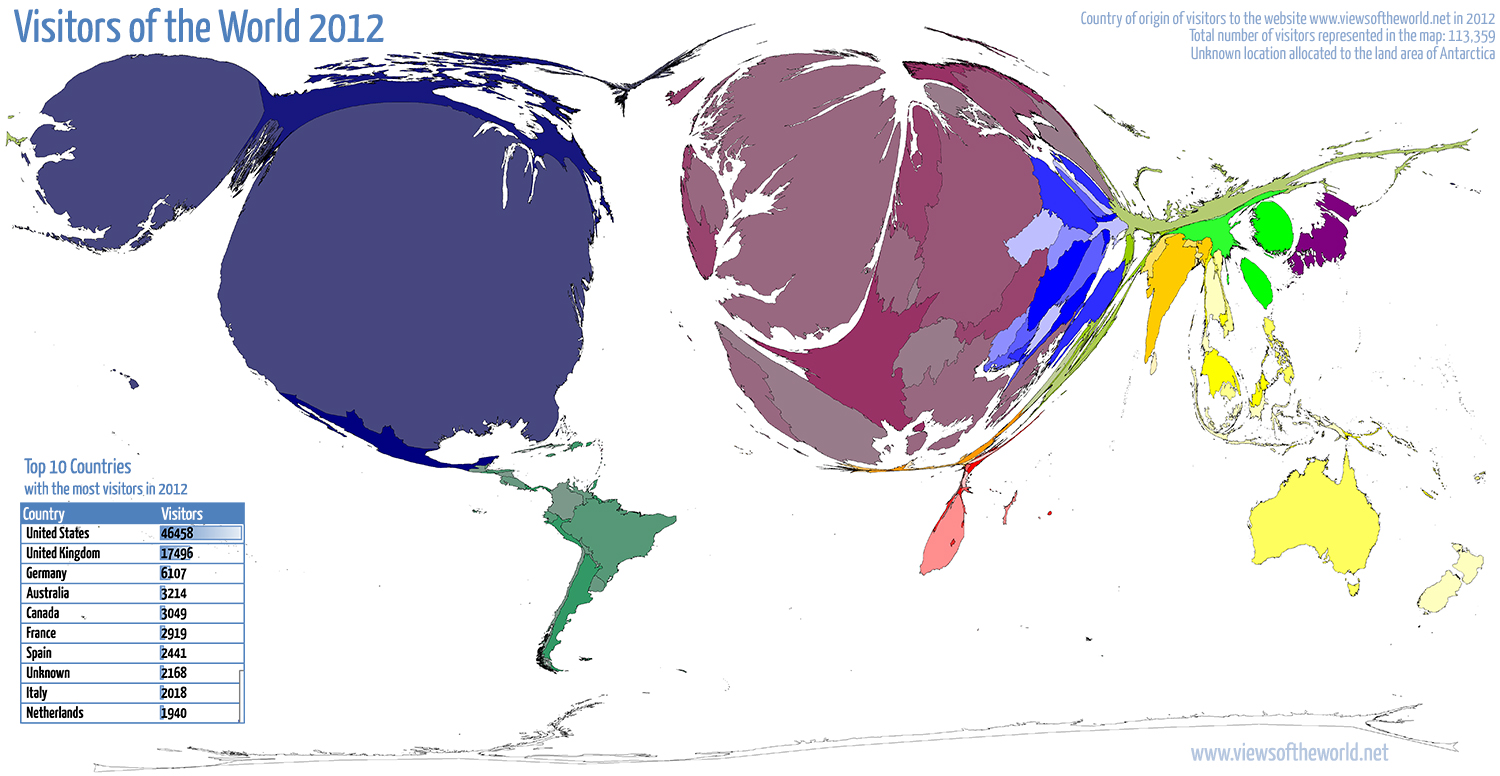
2012 has been a quite busy year on this website with the number of annual visitors breaking the 100,000 mark for the first time. The analytics tool Piwik which I use for monitoring my website counted precisely 113,359 visits in 2012, up from almost 90,000 the year before. So thanks everyone for visiting either once (as 85,000 people did) or as one of the 16,800 more regular visitors. This asks for a new map that’s showing, where each of the counted visits came from last year: 176 individual countries were counted, as well as a larger number of unknown origins (and of course all those who prefer blocking any analytics tool, they do not appear in any of these statistics). Despite such a large diversity of visits from around the world, the majority comes from places that one may expect, given certain characteristics of this website (language, location, etc.), and also given the accessibility of the internet, which until today remains a very unequal story, even if availability of the online world slowly finds its way to the less privileged places on this planet. But I digress, so here is the map of all visits to viewsoftheworld.net in 2012:
Tag Archives: worldmapper
A World Map of Organic Agriculture
Organic agriculture is a production system that sustains the health of soils, ecosystems and people. It relies on ecological processes, biodiversity and cycles adapted to local conditions, rather than the use of inputs with adverse effects. Organic agriculture combines tradition, innovation and science to benefit the shared environment and promote fair relationships and a good quality of life for all involved. (IFOAM 2009)
The practice of organic farming is not only relevant for soothing the bad conscience of wealthier societies, but it plays an important role in preserving croplands from degradation that is often caused by conventional intensive methods of farming. The Food and Agriculture Organization of the United Nations (FAO) recognised this need and set up the Organic Agriculture Programme. Its objective is “to enhance food security, rural development,sustainable livelihoods and environmental integrity by building capacities of member countries in organic production, processing, certification and marketing“. With a still growing world population and the rising demand for food, more sensible (and thus sustainable) ways of agriculture are needed more than ever to stop damage to the world’s arable lands.
In a joint paper published last year in the European Journal of Social Sciences (Vol. 24, Issue 3) John Paull and I presented a new world map of organic agriculture that presents countries as proportional in size to their share of the total of world organic hectares (data sources are described in the paper, reference see below):

Global Publishing Markets
From 10 to 14 October book lovers and publishers look to Frankfurt where the annual Frankfurt Book Fair takes place. However nostalgic one may see books, they are as much a commodity as any other traded good, and publishers – however committed to their business – look for a good business deal and reasonable revenues when agreeing to a new book project. On Worldmapper we looked at the number of books published in 1999. At request and with the help of the International Publishers Association (IPA) we have now updated this map using the most recent data that we could get. The following map takes a slightly different methodological approach and therefore displays not the total number of books, but represents domestic publishing markets by market value at consumer prices: Continue reading
2012 Paralympic and Olympic Medal maps
No more bread and circuses: London 2012 has turned into history while the Paralympic cauldron has been extinguished in a ‘Festival of Flame’. Just about time for a final roundup of the statistics of the games and the last maps that were still missing.
In the United Kingdom the spirit of the Olympics lived on in the Paralympics as created a similar media coverage (which has less been the case in many other countries). A lot of the public debate in Britain in the final debate of the Paralympics focussed on an increased relevance of the games – and that the results have started getting an equal importance as the Olympic medal counts. As already noticed at the Vancouver winter games, a comparison of the results showed some interesting differences in the achievements of the participating nations. This is shown in the following map animation of two cartograms showing each country’s share in the total medal counts (switching between the Paralympics and the Olympics 2012):

Athletes at the 2012 Paralympics
“It’s Official – London 2012 to be Biggest Paralympic Games Ever“, was the proud announcement at the Official Website of the Paralympic Movement ahead of this year’s Paralympic Games in London. While the games can not yet compete with the Olympics (over 10,000 athletes came to London just a few weeks ago), a new record has been set with over 4,200 athletes taking part at the 2012 Paralympics in the British capital. According to Wikipedia, this is “an increase of 250 athletes in comparison to the 2008 Summer Paralympics. They will represent 164 countries, 17 more than in Beijing. Fourteen countries will be making their Paralympic Games début: Antigua and Barbuda, Brunei, Cameroon, Comoros, the Democratic Republic of the Congo, Djibouti, the Gambia, Guinea-Bissau, Liberia, Mozambique, North Korea, San Marino, the Solomon Islands, and the US Virgin Islands“.
Leaving absolute numbers aside, the participation patterns in the Paralympics as shown in the following Worldmapper-style cartogram are not that strikingly different to those from the Olympics (a comparison to the Olympic Games can be found here). However, many interesting differences can still be spotted when looking at the details: China, and even more so Brazil are amongst the countries who (in relation) play an even bigger role, while the European dominance is slightly reduced, partly due to smaller shares of Eastern Europe (where Ukraine strikes out as one of the larger participants). In the Pacific, New Zealand’s size shrunk from is far larger number of athletes at the Olympics. The following map shows in proportion where all the sportsmen and women have traveled to London from this year (the two inset maps show the world’s population distribution in comparison and a conventional land area map as a reference):

Down to Earth: 32nd International Geographical Congress
 The world of geography is coming together in the German city of Cologne (Köln) for the 32nd International Geographical Congress. The IGC is the quadrennial meeting of the International Geographical Union (IGU). Continue reading