
“Eye care for all” is the motto of this year’s World Sight Day. But there are stark global inequalities in access to eye care. In 1971, Hart described the, ‘Inverse Care Law’ as the availability of good medical care varying inversely with the need for it in the population served. Hart was describing the situation in the National Health Service in Great Britain at the time in which he practiced as both a General Practitioner and an epidemiologist.
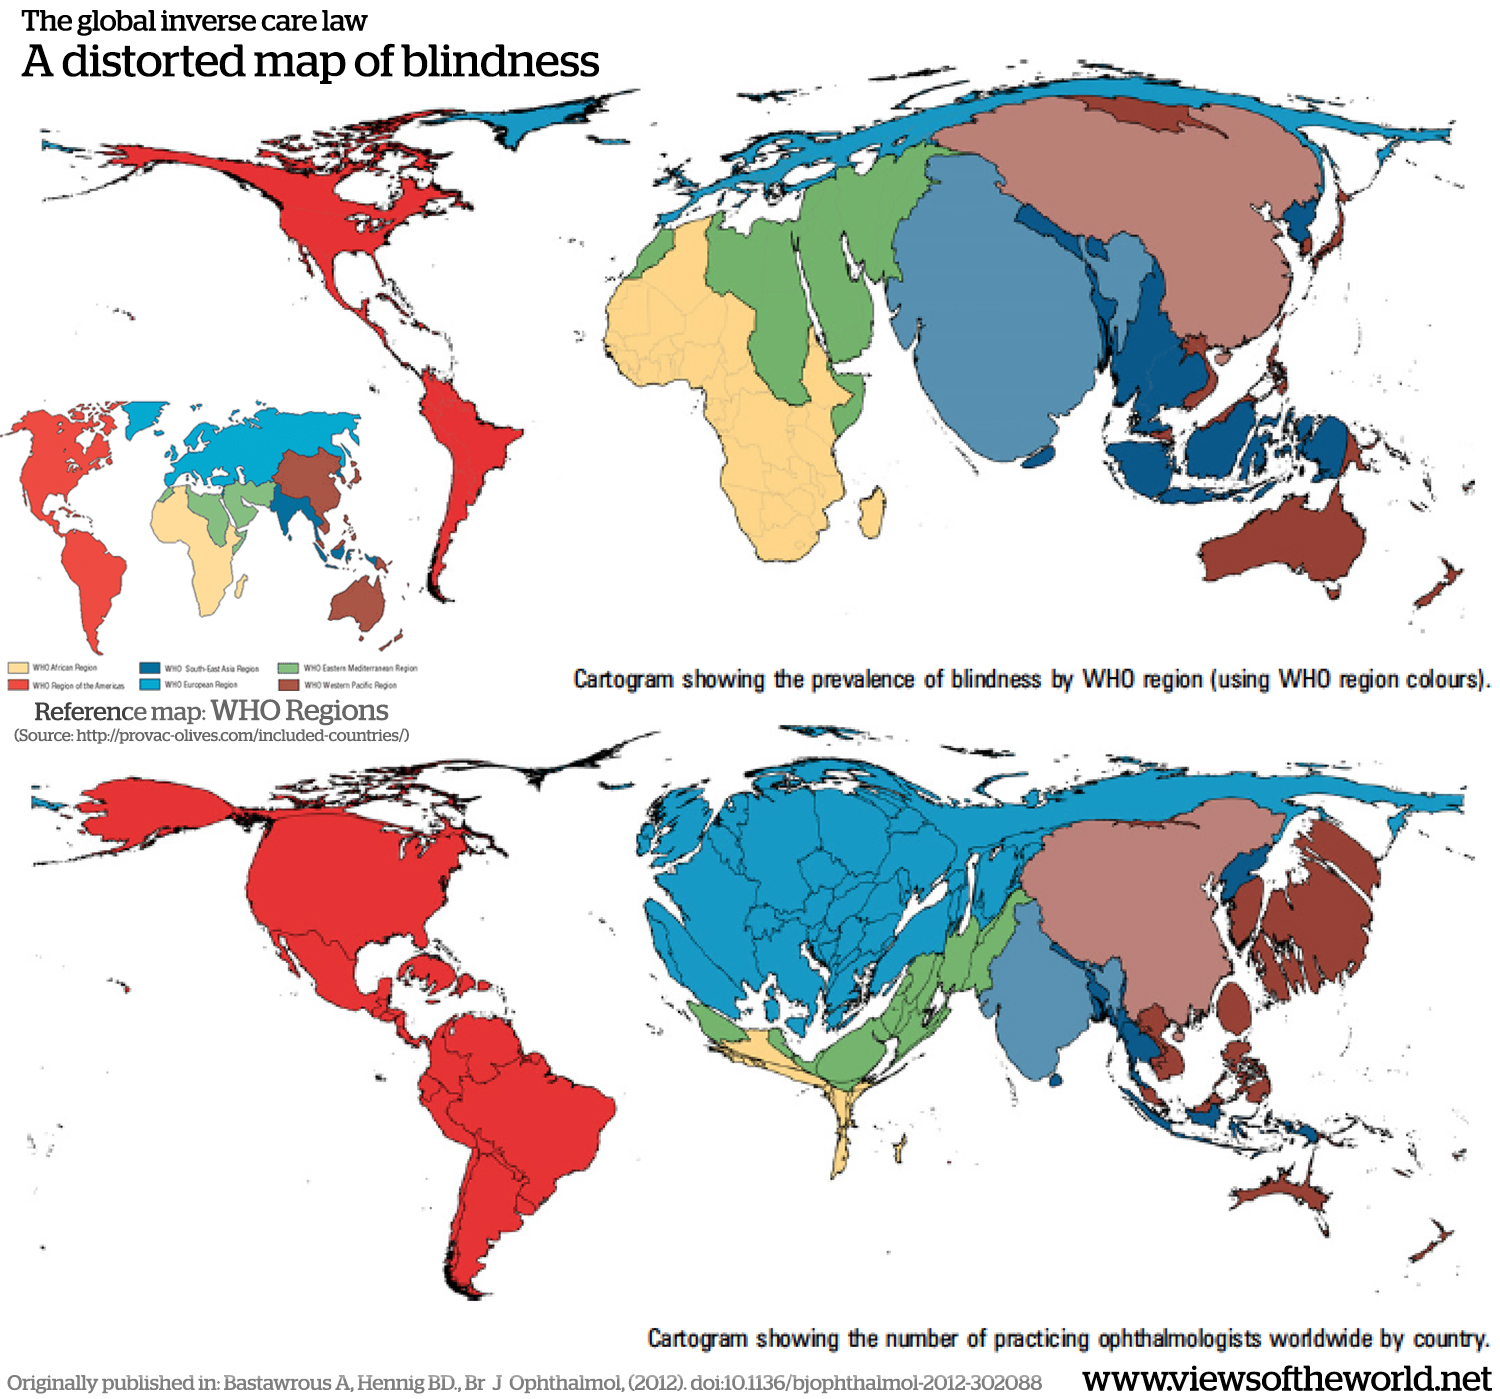
Two recently published articles demonstrate the ‘Inverse Care Law’ on a global level. The prevalence of blindness worldwide in 2010 was reported by the WHO and verified that low- and middle-income countries, as expected, have the highest prevalence of blindness and visual impairment. In stark contrast to this, a more recent report describes the,“Number of ophthalmologists in training and practice worldwide” providing global data for the number of ophthalmologists per county and demonstrates that despite a growing number in practice the gap between need and supply is widening.
The situation is also magnified within individual countries of high, middle and low-income. For example, in France, an inverse correlation was found between the number of ophthalmologists and the prevalence of low vision for subjects of similar age and socio-professional category and another example is in Kenya where of the 86 practicing ophthalmologists, 43 are based in Nairobi (personal correspondence). That equates to 50% of the countries ophthalmologists serving 8% of an already underserved population.
We have developed two cartograms to depict the data from these two papers using Gastner & Newman diffusion-based method. This allowed us to create density-equalised maps based on the absolute values provided in the papers. In the maps, each of the reference areas (WHO regions and countries) is resized according to these values. Larger areas represent higher numbers and smaller areas proportionally smaller data values:
Tag Archives: cartograms
Views of the 2015 UK election
The 2015 general election in the United Kingdom has ended with a very unexpected outcome resulting in a much clearer outcome as predicted in the polls. The Conservative Party with the old and new Prime Minister David Cameron has secured a majority in the new parliament, winning 331 of the 650 seats. As the BBC concludes: “The Conservatives win a 12-seat majority in parliament as Labour are almost wiped out by the SNP in Scotland and the Liberal Democrats suffer major losses.”
Looking at the election results in a conventional map, this very clear outcome becomes even stronger, with much of the map being dominated by blue (for the Conservatives) and yellow (for the Scottish National Party). Very little consolation for the main losers, but a more honest picture emerges, when changing the perspective, as shown in the following map series. The hexagon map shows the real political representation as it emerges in the Westminster Parliament, with every constituency being coloured according to the winning political party there. The third map in the series is an equal-population projection which gives every person living in the UK the same amount of space, so that the true picture of how people are being represented is painted. The latter differs slightly from the constituency view, as the constituencies in the UK are not only differing in (land area) size, but also in population size (which is part of a critical debate about electoral reform). So here is the complete picture of the 2015 general election:

Rising high: A brief history of the housing market
House price monopoly would be a better name for what has turned into a defining political issue ahead of the 2015 general election. As the ONS states in its latest release of long-term housing sales data, “the average price of sold houses in England and Wales has more than doubled since 1995” and “nearly a million properties were sold in 2013.” The dynamics of the housing market is about more than people looking for a place to live. It has become a substantial part of the British economy.
The following cartogram animation puts this trend into a vivid perspective. It shows the absolute value of all housing stock sold in a year for the regions of England as well as the boroughs of London, which itself becomes ever more dominant over the past two decades. Only in economic weaker times it loses some of its pace compared to the rest of England, but stays way ahead of any other region. The animation also takes the absolute value displayed in each map into account by resizing England according to the total value represented in each map, so that the full cartogram itself grows (and shrinks after the crash in 2008) over time:

World Cup Statistics
Where is all the football gone? While it’s another four years now to wait for the next Football (Soccer) World Cup, there is plenty of statistics to look back at from this year’s tournament in Brazil. “World” cup of course only applied to a small number of countries from around the world, as only 32 nations have qualified for the event. And then, one after another leaves early, so that the number of matches adds to the representation of countries and regions from around the world in this global sports event that – in terms of television ratings – is only superseded by the Olympics. Here is how the world looks distorted according to the total number of matches played at the 2014 World Cup:

And there is much more data that is counted during the event. The following map series looks into some of the statistics showing the distribution of goals, cards, fouls, tackles and much more of the action that went on during the four weeks in Brazil: Continue reading
London Borough Elections 2014
The London borough elections were held on May 22nd. A total of 1851 council seats (and also four mayoralties) were contested in 32 of the 33 boroughs in the British capital. The following map series produced for the Londonmapper Project shows the distribution of 1843 of the seats in the local councils as published on the London Councils election website (five seats in Tower Hamlets were still missing from the results, while the remaining seats are elected at postponed elections in a few of the wards). The maps show the individual distribution for each of the five main parties, i.e. Labour, Conservatives, Liberal Democrats, UKIP and Green Party (in order of their total number of seats) as well as Others (which are independent candidates as well as groups that only stood in individual borough, such as Tower Hamlets First who won 18 seats there). These are the new political shapes of London after what has been a small political earthquake in the country:

The European Union – Politics and People

Starting with the electorate in the Netherlands and the United Kingdom today, voters all across the European Union are going to the polls to elect a new European Parliament (while most of the EU member states hold their vote on Sunday after which the results will be announced). Continue reading