Global Water Insecurity

Global threats to human water security and river biodiversity is the title of a new study that points out that almost 80% of the world’s population are exposed to some risk of insecure freshwater resources (published in Nature 467, 555-561 (30 September 2010) | doi:10.1038/nature09440). The researchers created a global raster plotting the security level of water resources based on an index of water threats which is discussed in their paper.
Much of the threats in wealthier countries can be counteracted with technology, which explains much less actual insecurity in these countries – but therefore puts biodiversity at risk and resulting in a high price for an inevitable resource of human life.
Talking to BBC News Peter McIntyre from the University of Wisconsin, one of the scientists involved in the study, puts it this way:

“But even in rich parts of the world, it’s not a sensible way to proceed. We could continue to build more dams and exploit deeper and deeper aquifers; but even if you can afford it, it’s not a cost-effective way of doing things.” (Source: BBC)

The unaltered stress level of global freshwater resources as published in the study is presented in this map (Source: Nature):
Global geography of incident threat to human water security and biodiversity / Source: Nature
Accompanied by the map of biodiversity, this gives an interesting insight to the impacts on biodiversity. The impact on human population remains less shown in this depiction but is another crucial issue of the paper. As mentioned before, 80% of the world population are exposed to threatened water resources. By applying their map to the gridded-cartogram technique, the whole impact of these threatened water resources on the population becomes apparent. The 80% at risk become visible, as the map transformation preserves the geographical reference of the underlying grid. The emerging picture is going along quite well with the findings of the study and thus adds another interesting perspective on the issue of threatened water resources in the most populated regions in the world. All data from the study is available on http://www.riverthreat.net/data.html and we used that data to reproject the key maps of the study.
This map shows the “natural” picture of the human water security threat level from the study:

Map of Global Water Insecurity
(click for larger version)

When taking the investments on water technology into account, this picture changes considerably, as the next map shows:

Continue reading

Gridded Cartograms and the World Population Atlas

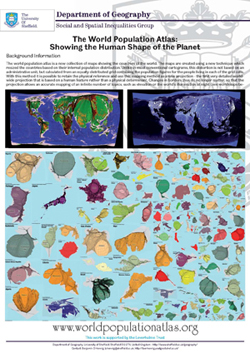
For this year’s 46th Annual Summer School of the Society of Cartographers I recalled the making of the World Population Atlas and wrapped all material up for some contributions for the meeting. The outcome are two new posters and a presentation for the delegate’s session:

The World Population Atlas: Showing the Human Shape of the Planet
Poster: The World Population Atlas
Poster: Gridded Population Cartograms: Drawing the Human Shape of the Planet
Poster: Creating Gridded Cartograms

The content on this page has been created by Benjamin Hennig. Please contact me for further details on the terms of use.

Magnificent Maps: Changing Perspectives

Magnificent Maps: Power, Propaganda and Art is an exhibition showing “80 of the largest, most impressive and beautiful maps ever made, from 200 AD to the present day”. The free exhibition still goes until 19 September 2010 at the The British Library in London.

The following map has been shown by Danny Dorling in one of the accompanying events. The lecture Changing perspectives: mapping global injustice by changing the view? introduced a series of maps using the gridded cartogram technique, some of which were shown to a wider audience for the first time. This map is a reprojection of the world according to the population distribution based on an equally distributed grid. The grid size in this map equals a 0.25° raster on a conventional map and a composite satellite raster image of the world has been transformed accordingly, so that the map reflects the population distribution in relation to the landscapes on which people are living:

Composite satellite image projected on a gridded world population cartogram
(click for larger view)

Continue reading

Pakistan’s Population

The monsoon rain has left a wide range of Pakistan‘s populated regions flooded. Especially the floodplains surrounding the River Indus are severly affected, as images of the Smos satellite show. Also other satellites, such as TerraSAR-X and the recently launched TanDEM-X support emergency response for the slowly growing international aid. These technologies are useful for location-related information, but to fully understand the dimension of the floods, it helps to have a closer look at the population distribution. The following gridded population cartogram (an enhanced version from the world population atlas) draws a picture of where people live in Pakistan. The underlying elevation information allows to understand the topography and the Indus is included for better orientation. The map shows that beyond the urban centres of the largest cities (labelled), much of the about 170 million people in the country are living along the rivers and in the floodplains while the Eastern and Southeastern regions remain less populated:

Pakistan Population Map
(click for larger map)

Continue reading

2010 Football Worldcup Maps

The Football Worldcup has entered its hot phase: The teams for the round of the last 16 is complete, and people around the world are embracing for the all-deciding playoffs. Well, not quite around the world. From the participants perspective, half of the 32 teams are already heading home. It may be half of the teams, but these do only represent some people at home: Many of the countries in the round of the last 16 are quite populous countries, as the following map reveals. It shows the worldcup participating countries resized according to their population size. The additional colour key shows quickly which countries are still in the tournament: Green represents those in the second round, whereas the red countries are out after the first round.

Football Worldcup 2010: The supporting population(click map for a larger view)

The map also confirms the inequality of the world of football. Not only the people of South Africa are no longer seeing their team compete, but most of the African competitors had to leave the first worldcup on the African continent early. The unequal shape of the football world is once more confirmed here, even if some of the big players already struggled (note the red patches in Europe).
Looking at population, one more map shows how few people are actually represented at the 2010 Worldcup: The following map is a world population cartogram (with updated population figures for 2010). This time, red countries are those who are (more or less) neutral observers of this event. These countries do not take part in the 2010 tournament – far more than half of the world population. Green countries are the participants (all of them, even those who are already out again), and an equal area map is added as an insect to see how some of the countries strike out with their large population:

(click map for a larger view)

Nevertheless, it remains a global event, with the largest audience that a sport event can get these days. So there is a lot to cheer and boo even beyond the borders of the participating nations. And in the end it’s only a game…isn’t it?

The content on this page has been created by Benjamin Hennig. Please contact me for further details on the terms of use.

South Africa: A people’s view

The ball is rolling, and the football world looks at South Africa and the South African people, who keep the world entertained with the unique Vuvuzela sounds. There are an estimated 49,320,000 living in the country, with an area of 1 221 037 square km this makes a population density of 41/km2. But the population is far from being equally distributed across the country. The following special worldcup edition of worldmapper’s gridded population cartograms shows where people are really living, and in which dimension the cities strike out in the population distribution. For easy orientation, all worldcup host cities are labelled. In addition elevation information is added to the map, so that one can see how many people live at which elevations.

A map of the population distribution and elevation in South Africa, including all 2010 Worldcup host citiesClick here for a larger view

The content on this page has been created by Benjamin Hennig. Please contact me for further details on the terms of use.