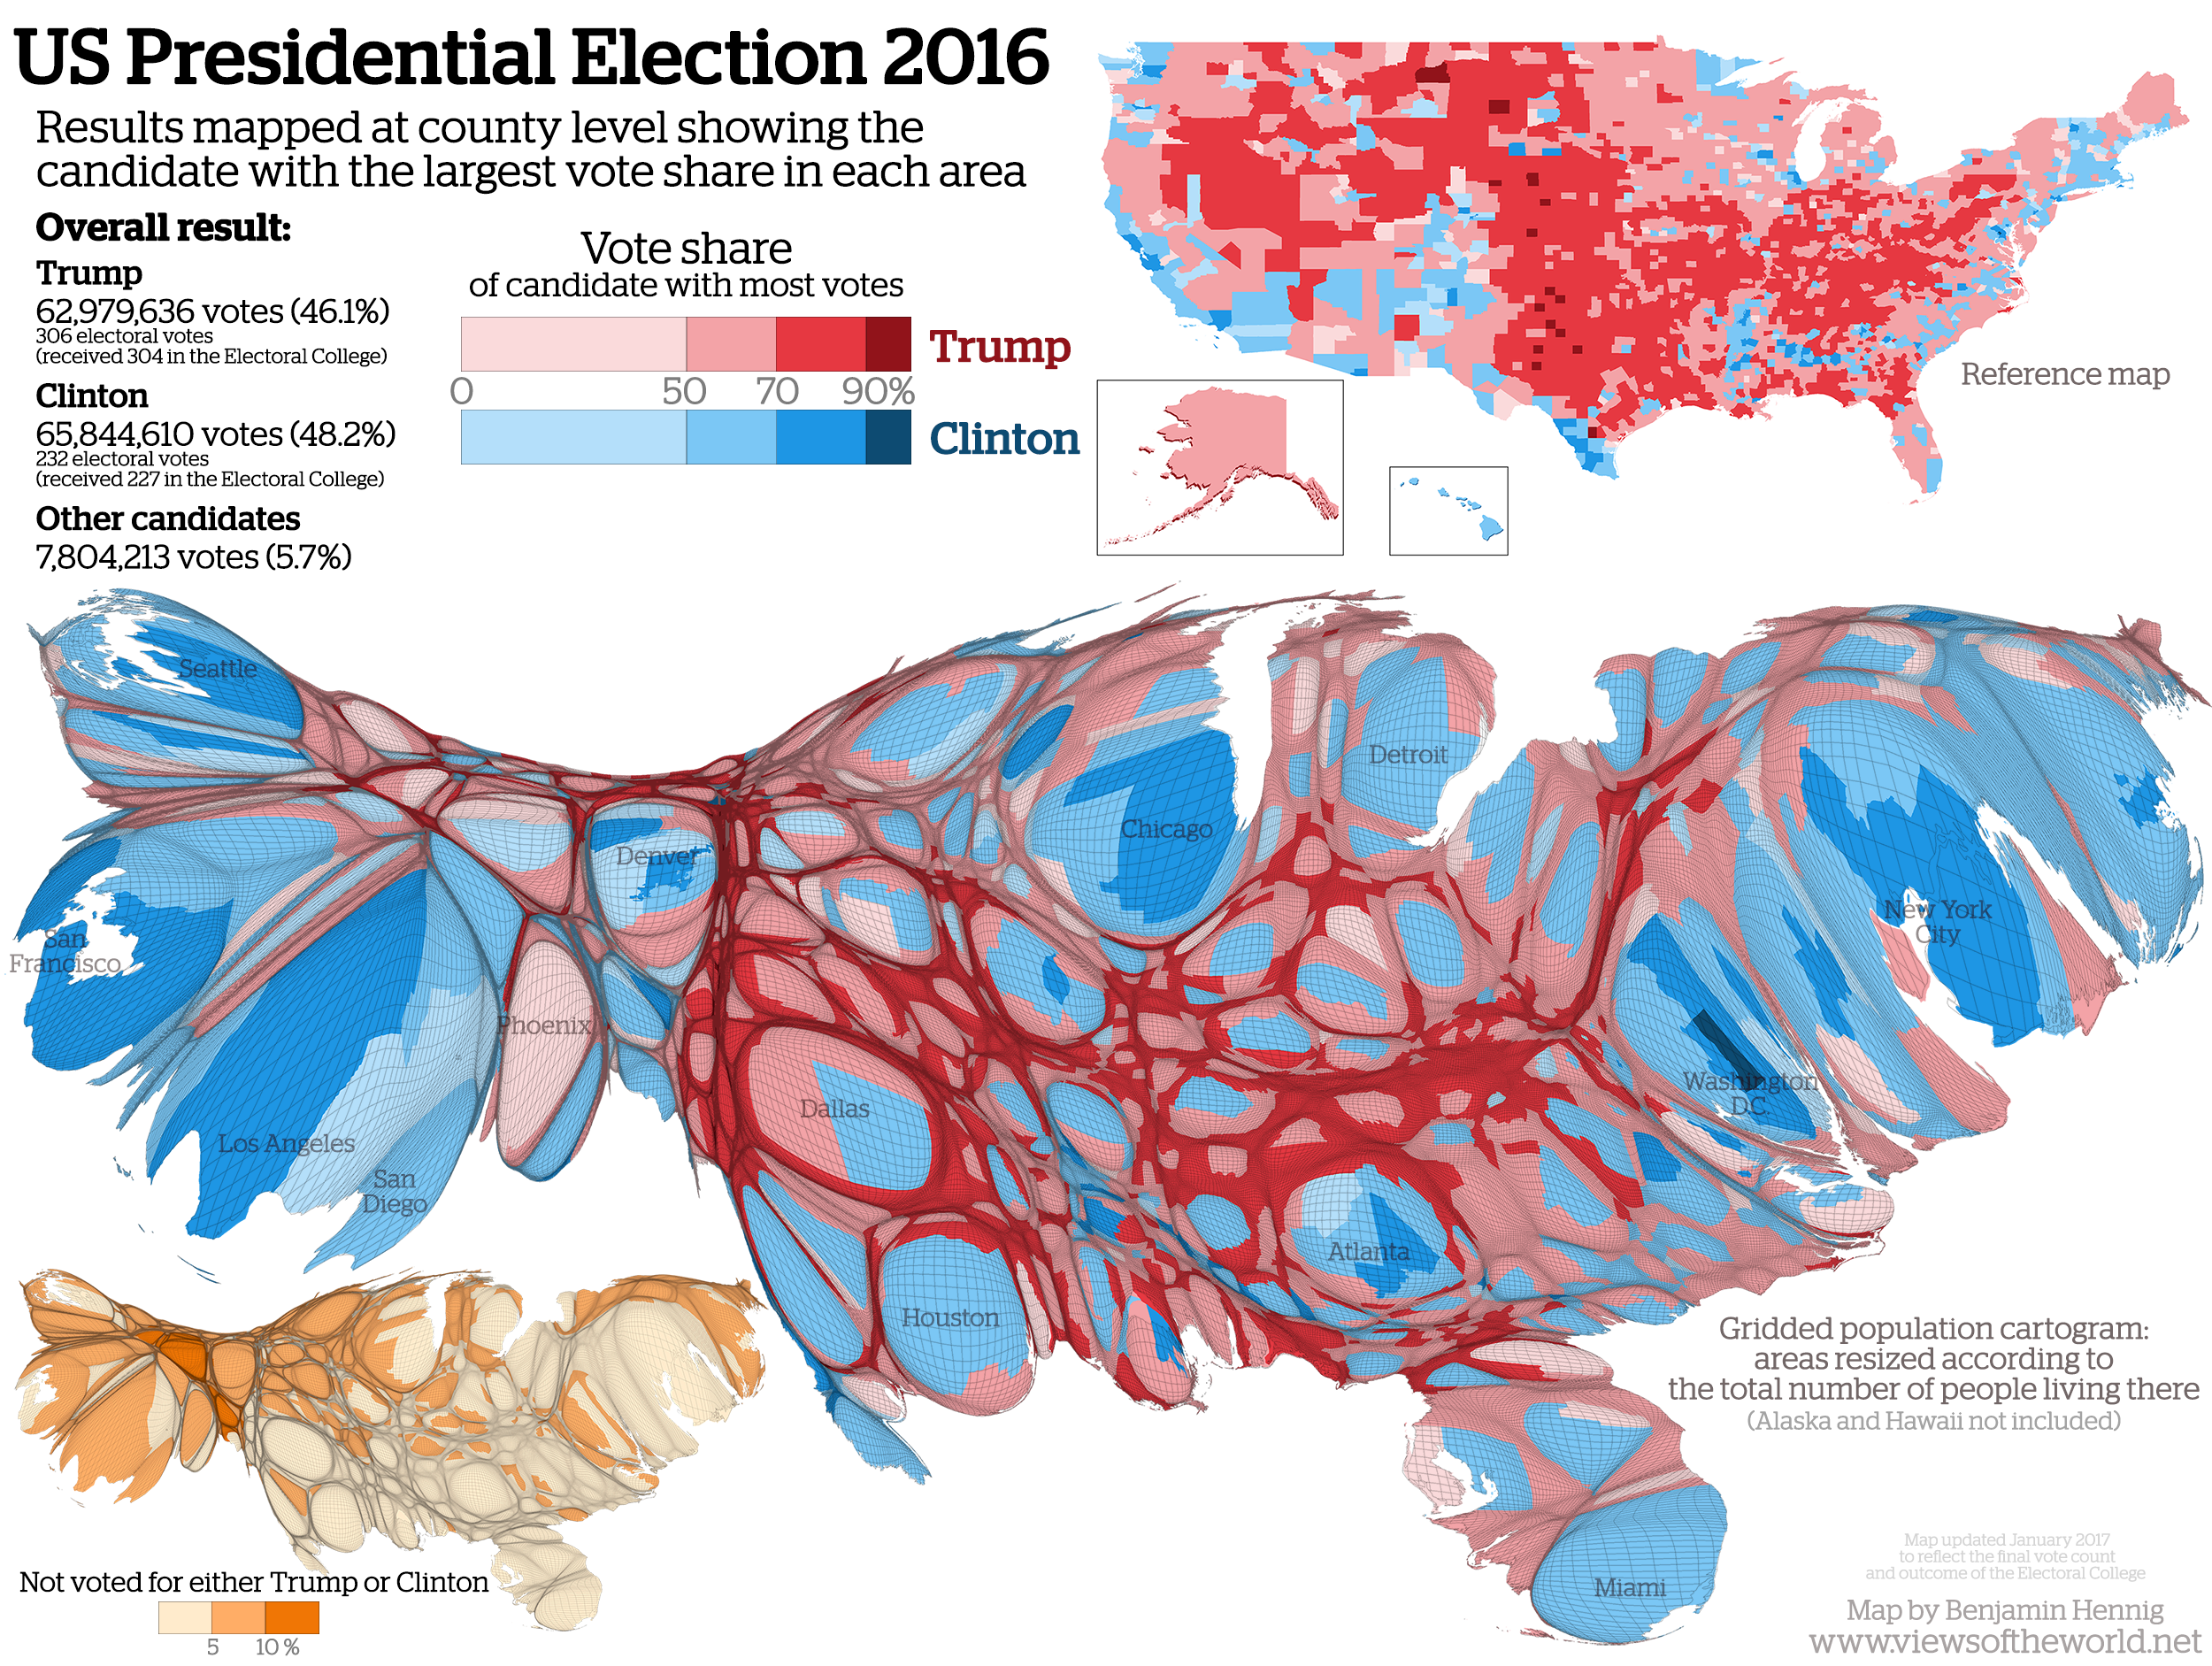
The electorate of the United States of America has come to a decision about who is to become their next president. But not quite the whole electorate went to the polls: Turnout was at a long-term low with about 55% of voting age citizen having cast their ballot in the 2016 presidential election. Long gone are the days in which up to around 80% of the electorate went to the polls: This was last seen in the 19th century.
62,979,636 votes (46.1%) were cast for Donald Trump, while Hillary Clinton received 65,844,610 votes (48.2%). Other candidates put together reached 7,804,213 votes (5.7%). The following cartogram shows the distribution of votes for the two main candidates. Shown in diverging colours is each respective candidate who received the largest share of votes in each county. The cartogram itself shows an equal-population projection (gridded population cartogram) where each grid cell in the map is resized according to the total number of people living there. The main cartogram is accompanied by a second cartogram showing the distribution of votes that went to neither of the two candidates, and a ‘conventional’ reference map that also shows the states of Alaska and Hawaii:
A Lonely Planet: Á hverfanda hveli?
This is the Icelandic version of a poster on mapping wilderness and remote areas created for the the 2016 Science Day at the University of Iceland (Vísindadagur Verkfræði- og náttúruvísindasvið, Háskóli Íslands):
Víðerni og afskekkt landsvæði ná yfir margbreytileg svæði á yfirborði jarðar. Slík svæði eru strjálbýl og eru að hluta til afsprengi af skipulagi sem hvetur til þéttingar byggða. Yfir helmingur jarðarbúa í dag býr á svæðum sem skilgreind eru sem borgir, og meira en 95% jarðarbúa býr á um 10% af yfirborði lands. Hin 90 prósentin eru þó fjarri því að vera einsleit víðernissvæði, Það eru mismunandi skoðanir á því hvort og þá hvernig eigi að nýta hin óbyggðu svæði heims.
Aðeins um 15% fólks í ríkari hluta heimsins býr í meira en klukkustundar fjarlægð frá næstu borg. Í fátækari hluta heimsins er hlutfallið 65%. Hér er kynnt nýstárleg nálgun á myndrænni framsetningu og skilningi á hinum afskekktu landsvæðum jarðar sem eru að líkindum hennar síðustu víðerni. Notuð er tækni sem kalla má „bjöguð hnitvörpun“ (gridded cartogram transformation). Tæknin er notuð til kortleggja hversu fjarlæg svæði eru í hugum meirihluta mannkyns. Niðurstöður sýna umfang afskektra svæða eins og það birtist með tilliti til ferðatíma til næstu borgar, hvort sem er yfir land, vötn eða sjó. Stærð hverrar svæðiseiningar byggir á útreikningi þess tíma. Kortið gefur afskekktum svæðum aukið rými og veitir nýja sýn á svæðisbundið umfang afskekktra svæða í hlutfalli við þéttbýl svæði.

Beyond fire and ice: Mapping Iceland in the 21st Century
Iceland and maps have a long tradition in the history of cartography. From the first maps of the country in the 16th century (including works from cartographers such as Ortelius and Mercator, also featuring some nice sea monsters) to today’s advanced digital mappings of Iceland’s diverse natural environment (such as this innovative mapping of water in Iceland or this quite beautiful representation of contour lines), Iceland never really had a lack of quite good cartographic works. Much less covered than the natural environment are the social landscapes of the country, such as this just recently updated version of a gridded population cartogram of the country where each grid cell is proportional to the number of people living in that area:

Renewable Energy
Renewable energy is defined as ‘energy from a source that is not depleted’. Main sources include biomass, hydropower, wind, biofuels, solar, heat pumps, biogas, geothermal, and marine (such as tidal power). Data by the International Energy Agency sees the share of renewable energy in global power generation at 22 per cent in 2013, with an estimated increase to 26 per cent by 2020 as a result of supportive policies by a large number of governments.

Storm Spaces
Tropical cyclonic systems are generally referred to as tropical storms. They are better known by their regional names, such as hurricanes in the Caribbean and North America, or typhoons in parts of Asia. They form near the equator over larger bodies of warm waters that evaporate from the ocean surface and fuel these emerging storm systems. Their strong winds and heavy rainfalls frequently become part of our news as they often put large numbers of human livelihoods at risk.
Recent studies show that the number of tropical cyclones (as well as tropical cyclone intensity) over the past decades has increased. Tracks of tropical storms collected over a longer period can indicate where such storms occur most frequently. The records used in this issue’s visualisation covers data from 1945 to 2008.

Rio 2016: Medals vs Athletes

Alternative ways of presenting the results of the Olympics has become more popular in recent years. Google – as other media outlets – did alternative medal counts allowing you to rank the medals not by their absolute numbers, but by other indicators such as population, GDP, or even more quirky themes such as fans or healthy eating. Continue reading