Global Water Insecurity

Global threats to human water security and river biodiversity is the title of a new study that points out that almost 80% of the world’s population are exposed to some risk of insecure freshwater resources (published in Nature 467, 555-561 (30 September 2010) | doi:10.1038/nature09440). The researchers created a global raster plotting the security level of water resources based on an index of water threats which is discussed in their paper.
Much of the threats in wealthier countries can be counteracted with technology, which explains much less actual insecurity in these countries – but therefore puts biodiversity at risk and resulting in a high price for an inevitable resource of human life.
Talking to BBC News Peter McIntyre from the University of Wisconsin, one of the scientists involved in the study, puts it this way:

“But even in rich parts of the world, it’s not a sensible way to proceed. We could continue to build more dams and exploit deeper and deeper aquifers; but even if you can afford it, it’s not a cost-effective way of doing things.” (Source: BBC)

The unaltered stress level of global freshwater resources as published in the study is presented in this map (Source: Nature):
Global geography of incident threat to human water security and biodiversity / Source: Nature
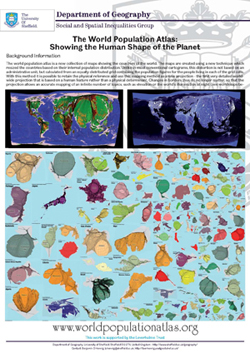
Accompanied by the map of biodiversity, this gives an interesting insight to the impacts on biodiversity. The impact on human population remains less shown in this depiction but is another crucial issue of the paper. As mentioned before, 80% of the world population are exposed to threatened water resources. By applying their map to the gridded-cartogram technique, the whole impact of these threatened water resources on the population becomes apparent. The 80% at risk become visible, as the map transformation preserves the geographical reference of the underlying grid. The emerging picture is going along quite well with the findings of the study and thus adds another interesting perspective on the issue of threatened water resources in the most populated regions in the world. All data from the study is available on http://www.riverthreat.net/data.html and we used that data to reproject the key maps of the study.
This map shows the “natural” picture of the human water security threat level from the study:

Map of Global Water Insecurity
(click for larger version)

When taking the investments on water technology into account, this picture changes considerably, as the next map shows:

Continue reading

Europe in debt

People across the worst hit countries by the proposed austerity measures to reduce national debt levels gathered on the streets of many European cities to protest against public spending cuts. The financial crash hugely affected many government across the EU with little signs of a quick recovery of the public debt levels.
The following map shows how Europe is left in deficit two years after Lehman (and that in fact the EURO zone isn’t worse off than EU members without the common currency). There may be signs of recovery, but this picture will certainly stay with us for a while:

Europe in debt: map of government deficit
(click for larger version)

Continue reading

Gridded Cartograms and the World Population Atlas

For this year’s 46th Annual Summer School of the Society of Cartographers I recalled the making of the World Population Atlas and wrapped all material up for some contributions for the meeting. The outcome are two new posters and a presentation for the delegate’s session:

The World Population Atlas: Showing the Human Shape of the Planet
Poster: The World Population Atlas
Poster: Gridded Population Cartograms: Drawing the Human Shape of the Planet
Poster: Creating Gridded Cartograms

The content on this page has been created by Benjamin Hennig. Please contact me for further details on the terms of use.

In Focus: The General Election 2010

Political InsightA map showing the detailed results of this year’s General Election in Great Britain is now featured in the “In Focus” section of Political Insight journal (September 2010, Volume 1, Issue 2). The accompanying article written by Danny Dorling and me includes a brief analysis of the swings in the new Parliament at Westminster.

Here are the bibliographic details:
Election Map 2010 Thumbnail image

  • Dorling, D. and Hennig, B. D. (2010). In Focus: General Election 2010. Political Insight1 (2): 72.
    Article online (Wiley)

More election maps can be found here.
The content on this page has been created by Benjamin Hennig. Please contact me for further details on the terms of use.

Magnificent Maps: Changing Perspectives

Magnificent Maps: Power, Propaganda and Art is an exhibition showing “80 of the largest, most impressive and beautiful maps ever made, from 200 AD to the present day”. The free exhibition still goes until 19 September 2010 at the The British Library in London.

The following map has been shown by Danny Dorling in one of the accompanying events. The lecture Changing perspectives: mapping global injustice by changing the view? introduced a series of maps using the gridded cartogram technique, some of which were shown to a wider audience for the first time. This map is a reprojection of the world according to the population distribution based on an equally distributed grid. The grid size in this map equals a 0.25° raster on a conventional map and a composite satellite raster image of the world has been transformed accordingly, so that the map reflects the population distribution in relation to the landscapes on which people are living:

Composite satellite image projected on a gridded world population cartogram
(click for larger view)

Continue reading

Pakistan’s Population

The monsoon rain has left a wide range of Pakistan‘s populated regions flooded. Especially the floodplains surrounding the River Indus are severly affected, as images of the Smos satellite show. Also other satellites, such as TerraSAR-X and the recently launched TanDEM-X support emergency response for the slowly growing international aid. These technologies are useful for location-related information, but to fully understand the dimension of the floods, it helps to have a closer look at the population distribution. The following gridded population cartogram (an enhanced version from the world population atlas) draws a picture of where people live in Pakistan. The underlying elevation information allows to understand the topography and the Indus is included for better orientation. The map shows that beyond the urban centres of the largest cities (labelled), much of the about 170 million people in the country are living along the rivers and in the floodplains while the Eastern and Southeastern regions remain less populated:

Pakistan Population Map
(click for larger map)

Continue reading